Early Classification of Diabetes Dataset
520 observations with 17 characteristics collected using direct questionnaires and diagnostic results from patients at Sylhet Diabetes Hospital, Sylhet, Bangladesh.
- Labeling Type: Diabetes Status
- Data Format: Tabular
- Data Type: Synthetic Data
Main Product
Data Quantity (Samples)
Total Price
$ 11,000
(VAT Included)Looking for custom-made dataset or researcher-accessible data? Please contact us for inquiries.
About Dataset
1) Data introduction
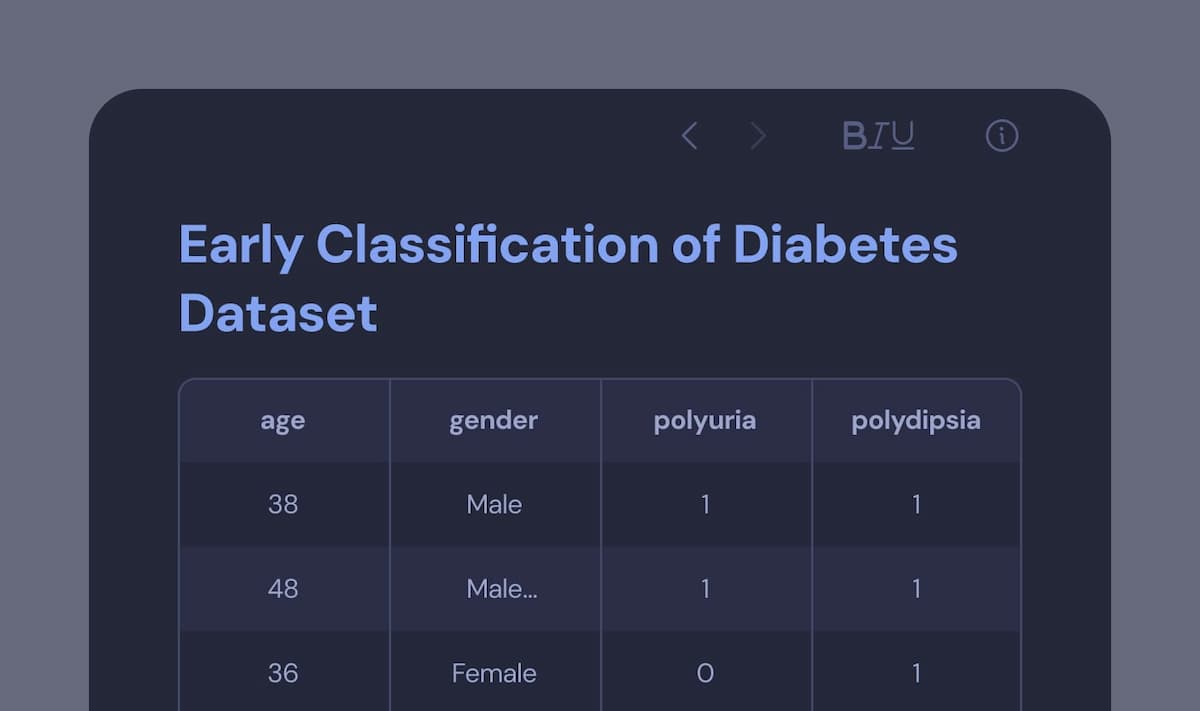
• Early-diabetes dataset contains 520 observations with 17 characteristics collected using direct questionnaires and diagnostic results from patients at Sylhet Diabetes Hospital, Sylhet, Bangladesh.2) Data utilization
(1) Early-diabetes data has characteristics that: • Predict diabetes risk using 16 tabular features, including age, gender, and polyuria. (2) Early-diabetes data can be used to: • Medical research: Researchers can use these data sets to study factors that contribute to the development of diabetes, identify key risk factors and help improve understanding of the disease. • Preventive healthcare: Using predictive models trained based on this data, healthcare providers can identify at-risk individuals early so they can intervene at the right time and create personalized treatment plans.Meta Data
Perfect

Outstanding

Data Samples

Utility
| Downstream Classification (▲) | Entropy (▲) | MMD (▼) | 2D Correlation Similarity (▼) | One Class Classification (▼) | Duplication Rate (▼) | |
|---|---|---|---|---|---|---|
| Total | 0 | 0 | 0 | 0 | 0 | 0 |
| Suitability | OK | OK | OK | OK | OK | OK |
The higher the value, the better (▲)
Model Performance
Downstream classification accuracy is an indicator used to evaluate the usefulness of synthetic data. It measures whether synthetic data performs similarly to real data. The method involves training the same model separately on real data and synthetic data, and then comparing the accuracies of the two models. Interpretation: A high accuracy rate means that the model trained on synthetic data performs similarly to the one trained on real data, indicating that the synthetic data is of high quality and well represents the real data.
The closer the value is to 0 or 1, or the lower the number, the better (▼)
Quality
MMD (Maximum Mean Discrepancy) is a metric used to assess the similarity between two probability distributions. It is commonly used to compare generated data with real data. High MMD score: A score above 0.05 indicates that the two distributions may differ. Low MMD score: Indicates that the generated data is similar to the real data. A score close to 0 is preferable, and a score below 0.01 suggests that the two data distributions are nearly indistinguishable.
Quality
2D Relationship Similarity measures the similarity in correlation structures between two datasets by comparing the correlation coefficients of columns in the original and generated data. High value (0.05 or above): Suggests differences in correlation structures, indicating the generated data may differ from the original. Low value: Indicates that the correlation structure of the generated data is similar to the original data. For instance, a 2D Relationship Similarity below 0.01 suggests the datasets are very similar.
Duplication Rate
Duplication Rate represents the proportion of identical or nearly identical items within a dataset. It is calculated by dividing the number of duplicate items by the total number of items. High Duplication Rate: Indicates lower data diversity and potential quality issues, which can reduce the reliability of analysis and models. Low Duplication Rate: Suggests higher data diversity and better quality.
Privacy
| Identification Risk (▼) | Linkage Risk (▼) | Inference Risk (▼) (Adjust by subtracting 0.5) | |
|---|---|---|---|
| Total | 0 | 0 | 0 |
| Suitability | OK | OK | OK |
The closer to zero or the lower the value, the better (▼)
Structural Similarity
Identification risk assesses how well synthetic data protects the privacy of the original data. It measures the likelihood that synthetic data can match records from the original data, thereby evaluating the potential for identifying specific individuals. Interpretation: A value closer to 0 indicates that the synthetic data is effectively protecting personal information. The level of risk considered safe can vary depending on the nature and sensitivity of the information contained in the data.
Perceptual Similarity
Linkage risk assesses the risk of inferring sensitive information from the original data using synthetic data. It measures the proportion of quasi-identifier values in the synthetic data that match those in the original data when an attacker knows quasi-identifier information from the original data. High Duplication Rate: Indicates lower data diversity and potential quality issues, which can reduce the reliability of analysis and models. Interpretation: A lower risk indicates that the data is safer, meaning there is a reduced likelihood of inferring sensitive information.
Premium Report Information

Premium dataset sample
