Brain Tumor MRI Dataset
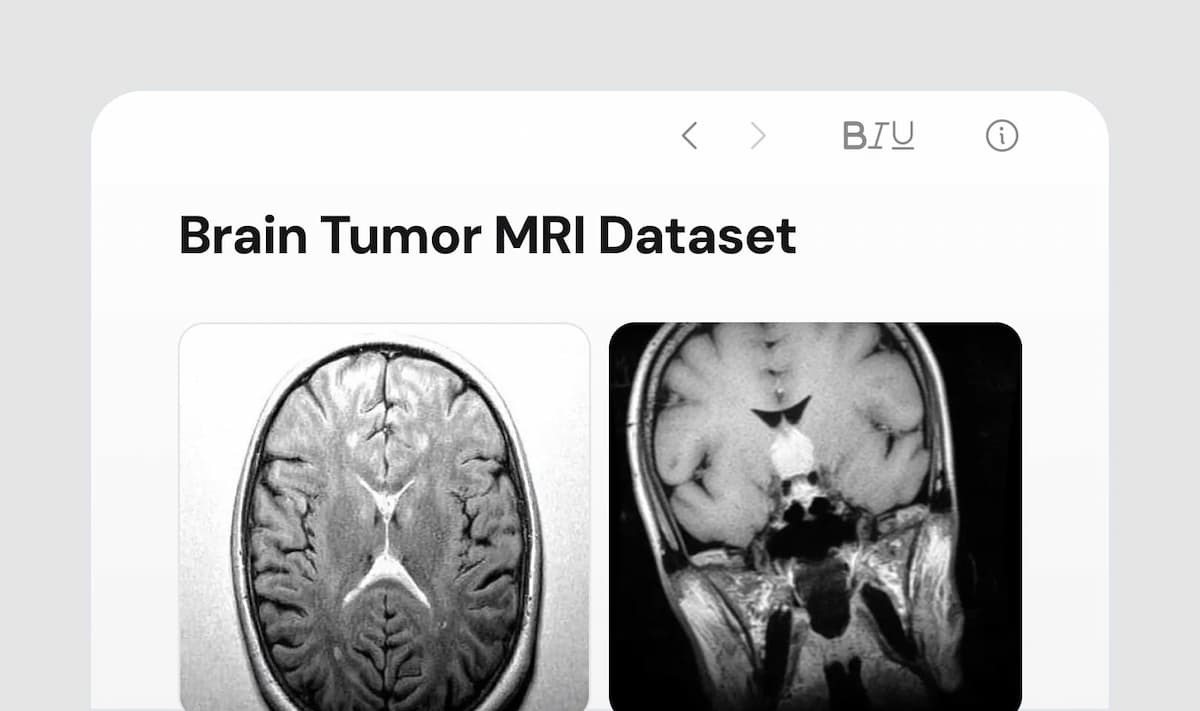
A curated collection of Magnetic Resonance Imaging (MRI) scans categorized into four classes: glioma, meningioma, pituitary tumor, and no tumor.
- Labeling Type: tumor
- Data Format: Image
- Data Type: Synthetic Data
Main Product
Data Quantity (Samples)
Total Price
$ 10,200
(VAT Included)Looking for custom-made dataset or researcher-accessible data? Please contact us for inquiries.
About Dataset
1) Data Introduction
• The Brain Tumor MRI Dataset is a collection of Magnetic Resonance Imaging (MRI) images curated for the classification of brain tumors. The dataset consists of MRI scans categorized into four classes: glioma, meningioma, pituitary tumor, and no tumor.2) Data Utilization
(1) Characteristics of the Brain Tumor MRI Dataset: • This dataset has been constructed as training data for artificial intelligence (AI) models aimed at the early detection and precise classification of brain tumors. It helps improve the accuracy and efficiency of medical diagnoses. • Each image is labeled with the tumor type, making the dataset well-suited for multiclass classification tasks. (2) Applications of the Brain Tumor MRI Dataset: • Development of tumor classification models: The dataset can be used to develop AI systems that automatically classify the type of brain tumor. • Detection of tumor location and boundaries: The dataset can be utilized to train models that not only detect the presence of a tumor but also identify its location and size, contributing to effective pre-surgical planning.Meta Data
Normal

Outstanding

Data Samples 5


Utility
| Downstream Classification (▲) | KID (▼) | One Class Classification (▼) | |
|---|---|---|---|
| Total | 0 | 0 | 0 |
| Suitability | OK | OK | OK |
The higher the value, the better (▲)
Model Performance
Downstream classification accuracy is an indicator used to evaluate the usefulness of synthetic data. It measures whether synthetic data performs similarly to real data. The method involves training the same model separately on real data and synthetic data, and then comparing the accuracies of the two models. Interpretation: A high accuracy rate means that the model trained on synthetic data performs similarly to the one trained on real data, indicating that the synthetic data is of high quality and well represents the real data.
The closer to zero or the lower the value, the better (▼)
Quality
KID (Kernel Inception Distance) is a metric used to evaluate the similarity between generated images and real images. It compares the differences between the two sample distributions using Kernel Mean Embedding, without assuming a normal distribution. Interpretation: A lower KID score suggests that generated images are more similar to real images, with a score close to 0 being ideal. Specifically, a score below 0.01 indicates very high similarity.
Privacy
| LPIPS (▲) | SSIM (▼) | |
|---|---|---|
| Total | 0 | 0 |
| Suitability | OK | OK |
The higher the value, the better (▲)
Perceptual Similarity
Learned Perceptual Image Patch Similarity (LPIPS) is a metric used to measure the visual similarity between two images by utilizing neural networks to extract key features and calculate the distance between them. High LPIPS value: Indicates high similarity between images, raising the risk of information leakage. Low LPIPS value: Suggests that synthetic images are perceptually different from real images, indicating a lower risk of sensitive information leakage.
The closer to zero or the lower the value, the better (▼)
Structural Similarity
The Structural Similarity Index Measure (SSIM) is a metric used to assess the similarity between two images. It is primarily used to compare the quality of a restored or compressed image with the original image. SSIM measures visual similarity by considering brightness, contrast, and structure.
High SSIM value (0.9 or above): Indicates that the synthetic image is very similar to the real image, which may increase the risk of information leakage.
Low SSIM value (0.6 or below): Indicates low similarity and reduced risk of leakage.
Premium Report Information

Premium dataset sample
