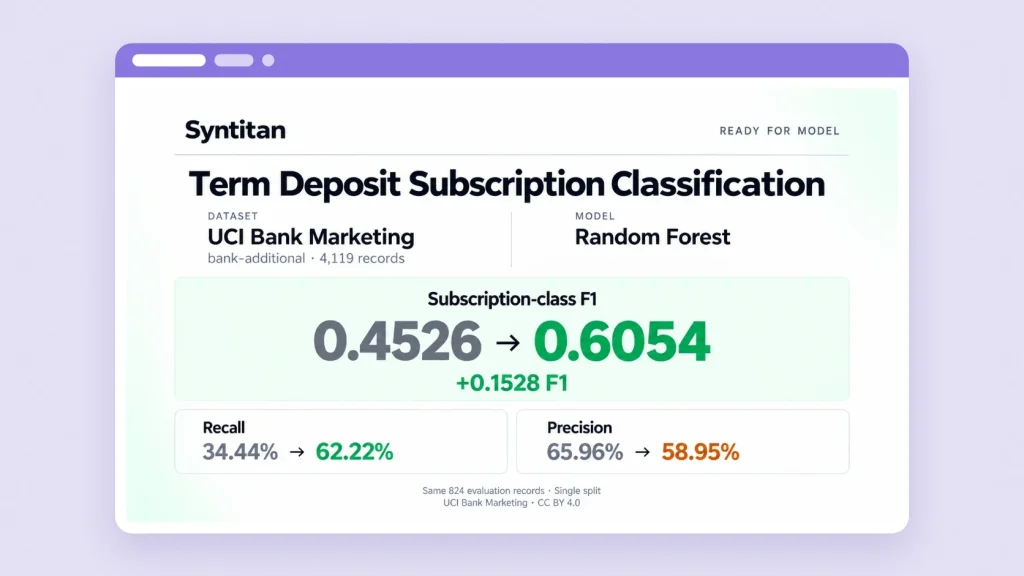
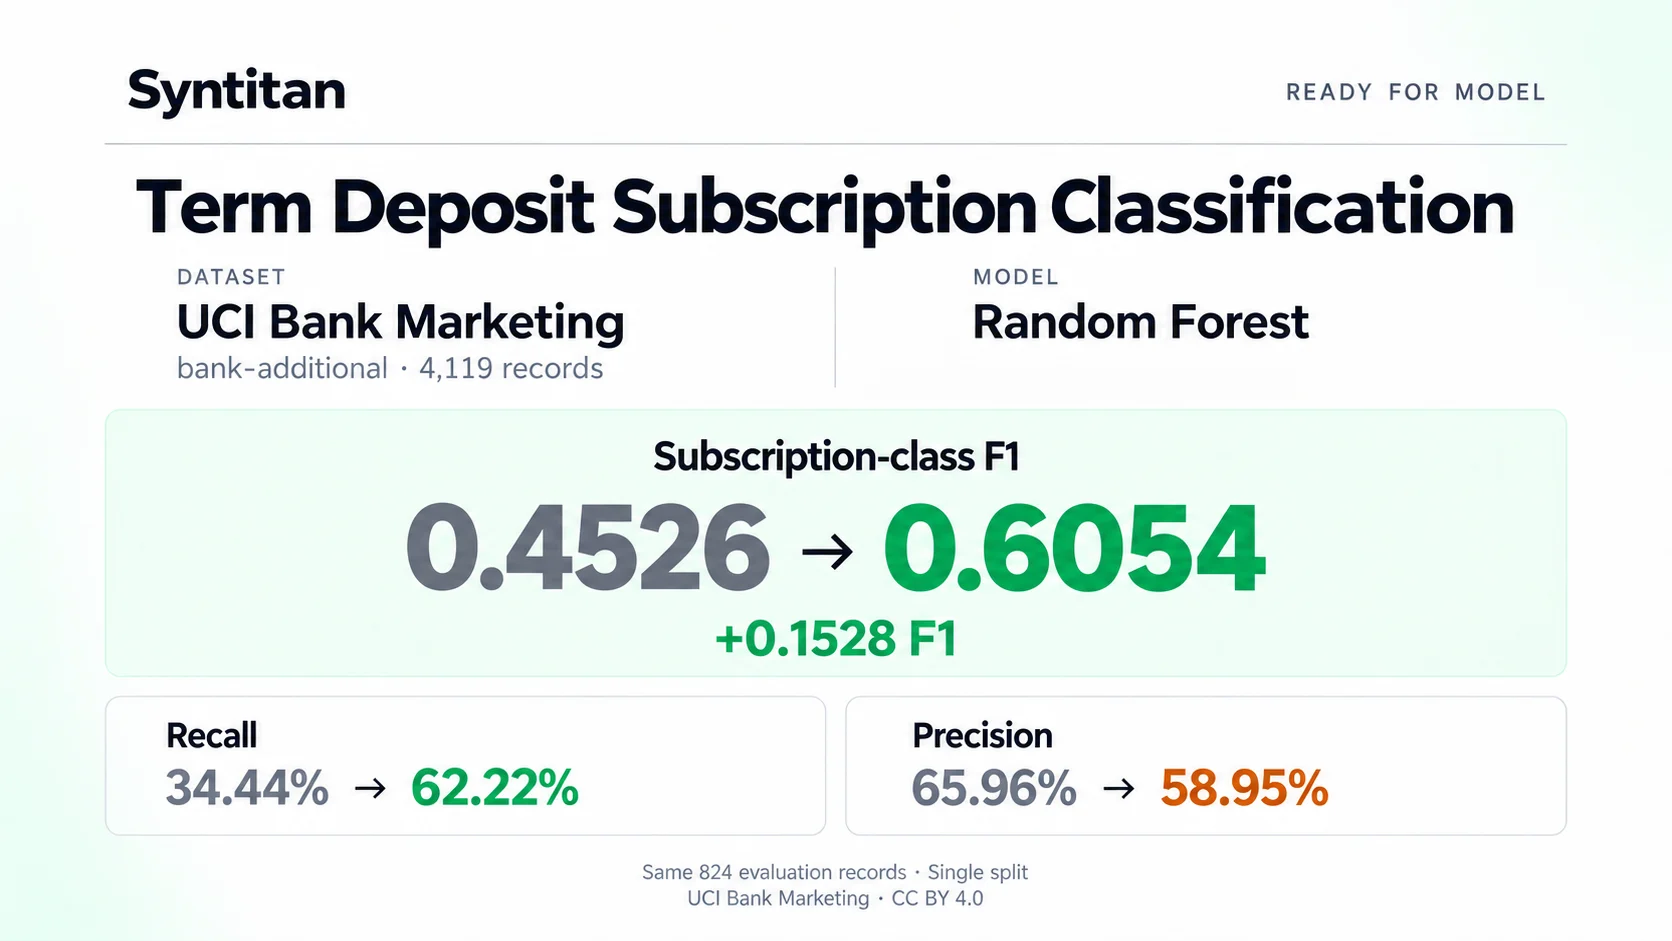
On the same evaluation set, a Random Forest model identified 56 subscription records after data preparation, compared with 31 before. It also incorrectly classified 39 non-subscription records as subscriptions, up from 16.
Overall accuracy barely changed: 90.90% to 91.14%. Subscription recall increased from 34.44% to 62.22%, while precision fell from 65.96% to 58.95%.
In campaign terms, the prepared-data model found 25 more customers who subscribed, and flagged 23 more who did not, on these 824 evaluation records. These are classifications of past records, not yet a test of whom to call.
We ran this experiment with Syntitan Ready for Model to examine how data preparation changes a model’s predictions. The result illustrates a specific trade-off: fewer missed subscription records, alongside more false positives.
More subscription records identified, more false positives. A higher F1 score describes that trade-off at one decision rule. It does not, on its own, show that the model became better at ranking subscription records.
Because the result came with the data, script and split files behind it, we could rerun that trade-off and check it ourselves (see Making the result inspectable, below).
Key takeaways
- The prepared data caught more subscribers: subscription recall rose from 34.44% to 62.22%, with the same Random Forest settings and the same evaluation records.
- It also raised more false alarms: false positives went from 16 to 39, so precision fell.
- Higher F1 did not mean better ranking: ROC-AUC and PR-AUC fell slightly, which is consistent with a shift toward positive predictions.
- The finding is narrow but checkable: one evaluation split, inputs that include call duration, and downloaded files that let us rerun both models.
The dataset and the comparison
We used bank-additional.csv from the UCI Bank Marketing dataset. It contains 4,119 records from telephone marketing campaigns at a Portuguese banking institution.
The target is whether a customer subscribed to a term deposit. There are 451 subscription records and 3,668 non-subscription records, so subscriptions account for roughly 11% of the data.
We split the records into:
- A training set of 3,295 records.
- An evaluation set of 824 records, containing 90 subscriptions and 734 non-subscriptions.
For the Random Forest experiment, the prepared dataset used 15 of the original 20 input variables. Its training block contained 897 additional subscription examples, increasing the subscription count from 361 to 1,258. The number of non-subscription training records stayed at 2,934.
We retrained the model separately on the original and the prepared data, using the same Random Forest settings. Both models were evaluated on the same original evaluation records, with the prediction rule unchanged.
- 01Same records
4,119 UCI Bank Marketing records, split into 3,295 for training and 824 for evaluation.
- 02Different training data
Original data, or prepared data with 15 of 20 input variables and 897 added subscription examples.
- 03Same model
The same Random Forest settings, retrained separately on each version.
- 04Same evaluation
The same 824 original records, with the prediction rule unchanged.
This comparison measures the combined effect of feature selection and augmentation. It does not isolate either step.
What changed in the predictions
The prepared-data model identified 25 more subscription records and produced 23 more false positives. Total classification errors fell from 75 to 73.
| Result on the same 824 evaluation records | Before | After |
|---|---|---|
| Subscription records correctly identified | 31 | 56 |
| Subscription records missed | 59 | 34 |
| Non-subscription records correctly classified | 718 | 695 |
| Non-subscription records incorrectly classified as subscriptions | 16 | 39 |
| Accuracy | 90.90% | 91.14% |
| Subscription recall | 34.44% | 62.22% |
| Subscription precision | 65.96% | 58.95% |
| Subscription F1 | 0.4526 | 0.6054 |
These are observations from one evaluation split with 90 positive records. We have not established whether the changes hold consistently across repeated splits, cross-validation, or an independent dataset.
The 25 additional subscriptions identified should therefore be read as a result on this evaluation set, not as an expected gain on future records.
Higher F1 did not mean better ranking performance
The subscription-class F1 score increased from 0.4526 to 0.6054. However, two metrics that assess performance across decision thresholds decreased:
| Metric | Before | After |
|---|---|---|
| ROC-AUC | 0.9460 | 0.9416 |
| PR-AUC (reported using average precision in the evaluation script) | 0.6320 | 0.6172 |
After preparation, the model classified 95 records as positive, compared with 47 before. Labeling more records as positive captured more subscriptions, but also more non-subscriptions.
This pattern is consistent with a shift toward positive predictions at the existing decision rule. It does not establish that the model became better at ranking subscription records above non-subscription records.
The experiment also does not show that data preparation is the best way to obtain this trade-off. We did not compare it with a model trained on the original data with adjusted class weights, or with a decision threshold selected on a separate validation set.
Those are important baselines. A useful follow-up would compare the models at similar recall and check which produces fewer false positives. Until then, the supported claim is narrower: this preparation changed the precision–recall balance and increased F1 at the evaluated decision rule.
A second model showed a different trade-off
We also reran the Logistic Regression comparison using the downloaded model script.
For that model, preparation added 10 derived features and 897 subscription examples to the training data. Subscription recall increased, but precision and overall accuracy decreased.
| Model and condition | Accuracy | Precision | Recall | F1 |
|---|---|---|---|---|
| Random Forest, before | 90.90% | 0.6596 | 0.3444 | 0.4526 |
| Random Forest, after | 91.14% | 0.5895 | 0.6222 | 0.6054 |
| Logistic Regression, before | 91.38% | 0.7111 | 0.3556 | 0.4741 |
| Logistic Regression, after | 89.68% | 0.5225 | 0.6444 | 0.5771 |
Precision, recall, and F1 refer to the subscription class.
| Model and condition | True negatives | False positives | False negatives | True positives |
|---|---|---|---|---|
| Random Forest, before | 718 | 16 | 59 | 31 |
| Random Forest, after | 695 | 39 | 34 | 56 |
| Logistic Regression, before | 721 | 13 | 58 | 32 |
| Logistic Regression, after | 681 | 53 | 32 | 58 |
The comparison makes the trade-offs of each preparation approach visible. Both models missed fewer subscription records after preparation, but both also produced more false positives.
What we could verify from the downloaded files
The experiment’s downloadable package included, for each model:
data_before.csvanddata_after.csv.- A standalone training and evaluation script,
run_model.py. - Evaluation-split information in
proof_split.json.
These files allowed us to rerun the Random Forest and Logistic Regression comparisons and inspect their confusion matrices.
The split information places the augmented records in the training block and identifies which original records were used for evaluation. None of the augmented records were in the scored evaluation set.
This check is narrower than a complete audit of the preparation pipeline. The package did not include the upstream generation code, or enough information to establish the exact augmentation method. Nor did it independently establish whether feature selection and every learned preparation step were fitted only on training data.
Reproducing the model scores from the prepared files is useful evidence, but it does not by itself rule out upstream leakage. A complete validation should document the augmentation method and confirm that all data-dependent preparation is fitted within the training split.
Why call duration changes the interpretation
The inputs include duration: the length of the last contact.
That information is available after a call, not when deciding whom to contact. This experiment therefore evaluates subscription classification using call information. It does not demonstrate pre-call targeting performance.
We have not yet run a comparison without duration. That test would be needed before using this experiment to support claims about selecting prospects before outreach.
Likewise, correctly classifying more historical subscription records does not mean a campaign would generate more subscriptions. That would require a separate operational evaluation.
Making the result inspectable
For this experiment, Syntitan Ready for Model provided a way to compare predictions before and after data preparation, and to download the data, model scripts, and evaluation-split information.
That made it possible to look beyond a headline score. We could inspect which errors increased, which decreased, and whether the reported model results could be reproduced from the downloaded files.
The next step is to strengthen the comparison:
- Add class-weight and threshold-adjustment baselines. Compare the models at similar recall and check which produces fewer false positives.
- Repeat the evaluation across splits. Check whether the changes hold beyond one split with 90 positive records.
- Test without call duration. Run this before using the experiment to support claims about selecting prospects before outreach.
- Document the preparation pipeline fully. Record the augmentation method and confirm that all data-dependent preparation is fitted within the training split.
For now, the finding is specific. On this evaluation set, the prepared-data Random Forest identified more subscription records and achieved higher F1, while generating more false positives and slightly lower ranking metrics.
That is a measurable change in model behavior, and a starting point for deciding what to test next.
Dataset and experiment details
| Item | Details |
|---|---|
| Dataset | UCI Bank Marketing, bank-additional.csv |
| Records | 4,119 |
| Original input variables | 20 |
| Target | y: term-deposit subscription, yes or no |
| Class distribution | 451 subscriptions; 3,668 non-subscriptions |
| Original training set | 3,295 records |
| Evaluation set | 824 records: 90 subscriptions and 734 non-subscriptions |
| Reproduced comparisons | Random Forest and Logistic Regression |
| Positive class | Subscription (yes) |
| Dataset creators | S. Moro, P. Rita, and P. Cortez |
| License | CC BY 4.0 |
Source: UCI Machine Learning Repository: Bank Marketing
Dataset citation: Moro, S., Rita, P., & Cortez, P. (2014). Bank Marketing [Dataset]. UCI Machine Learning Repository. https://doi.org/10.24432/C5K306
The source data was processed using Syntitan Ready for Model as described above. Campaign costs, revenue impact, and workflow time savings were not measured.