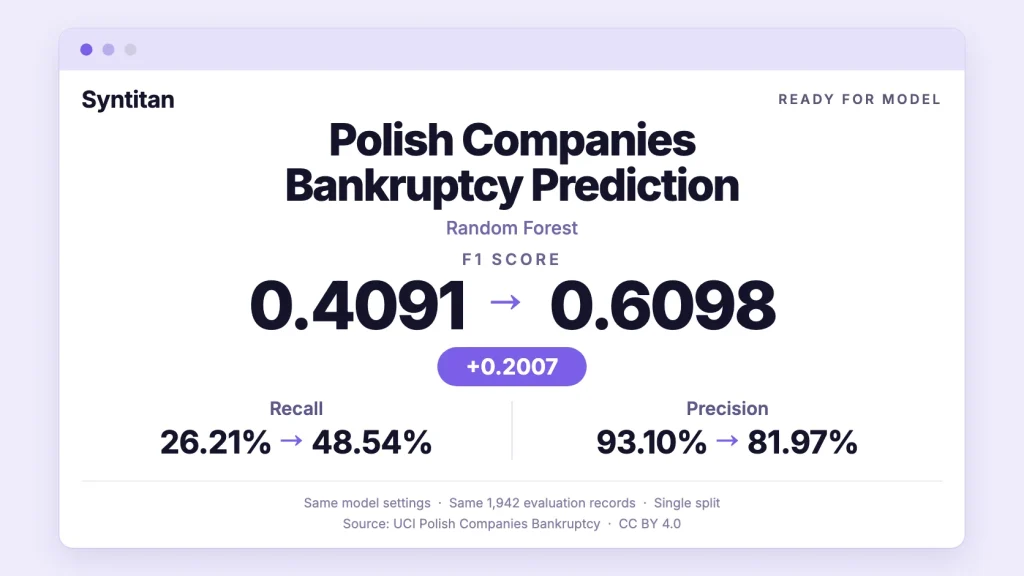
How Syntitan’s data preparation changed bankruptcy predictions across four models, with model settings held fixed within each comparison.
On the UCI Polish companies bankruptcy dataset, a Random Forest model identified 27 of 103 bankruptcy records in our evaluation set. After additional data preparation with Syntitan, it identified 50.
F1 increased from 0.4091 to 0.6098 with the same Random Forest settings. False positives also increased, from 2 to 11. On the same evaluation records, Logistic Regression showed a different result: more bankruptcy cases detected and fewer false alarms.
We compared four models to see how each responded to data preparation. All four recorded higher F1 scores, but the size and nature of the changes differed.
Key takeaways
- Random Forest F1 rose from 0.4091 to 0.6098 with the same settings: 23 more bankruptcy records detected, alongside 9 more false positives.
- Logistic Regression improved precision and recall together, finding 50 bankruptcy records with 5 false positives, down from 11.
- XGBoost and LightGBM started stronger and gained less. XGBoost kept the highest final F1 at 0.7241; LightGBM’s ranking metrics fell despite higher F1.
- The result comes from one split with 103 bankruptcy records. The exported files let us rerun model training and scoring for all four comparisons, but not the upstream preparation steps.
The UCI Polish Companies Bankruptcy dataset
The UCI Polish Companies Bankruptcy dataset contains financial-statement records for bankruptcy classification. Its variables describe profitability, liabilities, liquidity, and other financial characteristics.
UCI provides five forecasting cases. The 9,792-record case, distributed as 4year.arff, has a two-year prediction horizon and includes 515 bankruptcy records. The filename of our export points to this case; the comparison files themselves begin at a later preparation stage.
The exported baseline contains 9,710 records: 513 bankruptcy and 9,197 non-bankruptcy records. Its inputs include 64 financial attributes and 62 missing-value indicators, with no remaining missing cells. It is therefore already a prepared representation, rather than an untouched UCI file. The export does not explain the 82-record difference from the source case.
The experiment measures the effect of further preparation from that baseline. Anyone interpreting or reproducing the results needs to start from the same point.
Comparing four models on the same evaluation records
We used Syntitan’s Ready for Model workflow and reran the exported Proof Kit scripts for Random Forest, Logistic Regression, LightGBM, and XGBoost. All four reruns reproduced the rounded F1 scores reported in the export. The kit covers training and scoring from the supplied before and after datasets; it does not include the steps that produced those datasets.
The baseline split contains 7,768 training records and 1,942 evaluation records. The evaluation set has 103 bankruptcy records and 1,839 non-bankruptcy records. The split metadata identifies the same evaluation positions across all four models.
Within each model’s comparison, the model settings and classification threshold of 0.5 stayed fixed. Each model was retrained separately on its before and after training data. Preparation differed by model.
| Model | F1 before | F1 after | Change |
|---|---|---|---|
| Random Forest | 0.4091 | 0.6098 | +0.2007 |
| Logistic Regression | 0.4698 | 0.6329 | +0.1631 |
| LightGBM | 0.6792 | 0.7052 | +0.0260 |
| XGBoost | 0.7037 | 0.7241 | +0.0204 |
These results come from a single split with 103 positive evaluation records. They are not a time-based validation or evidence of performance on current companies. Repeated and time-based evaluation would be needed to assess stability and future use.
Random Forest: F1 from 0.41 to 0.61
Random Forest showed the largest F1 improvement. Recall rose from 26.21% to 48.54%, while precision fell from 93.10% to 81.97%.
| Prediction outcome | Before | After |
|---|---|---|
| Bankruptcy records correctly identified | 27 | 50 |
| Bankruptcy records missed | 76 | 53 |
| Non-bankruptcy records incorrectly flagged | 2 | 11 |
| Non-bankruptcy records correctly classified | 1,837 | 1,828 |
That is 23 more bankruptcy records detected, alongside 9 more false positives. Total classification errors fell from 78 to 64.
Accuracy moved only from 95.98% to 96.70%. Bankruptcy makes up about 5.3% of the evaluation records, so accuracy alone hides how many bankruptcies a model misses. Even after preparation, Random Forest still missed 53 of 103 bankruptcy records.
The ranking metrics were mixed: average precision increased from 0.6437 to 0.6728, while ROC-AUC slipped from 0.9269 to 0.9253. The higher F1 reflects a shift in the operating point, not an across-the-board ranking improvement: at the fixed 0.5 threshold, the retrained model flags more records and trades some precision for higher recall.
Logistic Regression: more detections, fewer false positives
Logistic Regression’s F1 rose from 0.4698 to 0.6329. It identified 50 bankruptcy records, up from 35, while false positives fell from 11 to 5.
Both precision and recall increased: precision from 76.09% to 90.91%, and recall from 33.98% to 48.54%. Total errors fell from 79 to 58.
This model reached the same bankruptcy detection count as the prepared Random Forest while producing fewer false positives. Its ROC-AUC increased from 0.8971 to 0.9023, and average precision rose from 0.5533 to 0.6358.
The two results illustrate why the preparation comparison needs to be model-specific. A larger F1 increase is useful information, but final performance and the balance of missed cases and false alarms also matter.
XGBoost and LightGBM: stronger baselines, smaller F1 gains
| Model | Precision before → after | Recall before → after | TP before → after | FP before → after |
|---|---|---|---|---|
| Random Forest | 0.9310 → 0.8197 | 0.2621 → 0.4854 | 27 → 50 | 2 → 11 |
| Logistic Regression | 0.7609 → 0.9091 | 0.3398 → 0.4854 | 35 → 50 | 11 → 5 |
| LightGBM | 0.9643 → 0.8714 | 0.5243 → 0.5922 | 54 → 61 | 2 → 9 |
| XGBoost | 0.9661 → 0.8873 | 0.5534 → 0.6117 | 57 → 63 | 2 → 8 |
Note: TP is the number of bankruptcy records correctly identified; FP is the number of non-bankruptcy records incorrectly flagged.
XGBoost retained the highest final F1, at 0.7241. It detected 6 additional bankruptcy records and produced 6 additional false positives, leaving accuracy unchanged at 97.53%.
LightGBM detected 7 additional bankruptcy records and produced 7 additional false positives. Its accuracy also stayed unchanged, at 97.37%.
Despite its higher F1, LightGBM’s ROC-AUC fell from 0.9677 to 0.9603 and average precision fell from 0.8104 to 0.7725. XGBoost improved on both, from 0.9568 to 0.9580 for ROC-AUC and from 0.7688 to 0.7958 for average precision. F1 alone would not reveal this difference.
What changed in the training data
The preparation summary lists LLM feature generation and minority-class augmentation for Random Forest, feature generation alone for Logistic Regression, and minority-class augmentation for LightGBM and XGBoost.
The Random Forest and Logistic Regression datasets each add 20 features. Their names describe ratios, products, missingness interactions, and rule-based conditions. The input count rises from 126 to 146, excluding the target.
For the three augmented models, the positive training count rises from 410 to 3,154, adding 2,744 records. The negative training count remains 7,358, bringing the prepared training total to 10,512. Logistic Regression’s training count remains 7,768.
The exported split metadata keeps the added records in the training block. Evaluation remains on the same 1,942 baseline records.
The Proof Kit supports rerunning training and scoring from the supplied datasets. It does not include the full feature-generation or augmentation procedure, or the earlier processing that produced the baseline. Verifying that no data leakage occurred, and that every learned transformation was fitted on training data alone, requires upstream pipeline records beyond this export.
What the Proof Kit lets us check
The before-and-after datasets, execution scripts, and split metadata make the comparison inspectable. Rerunning them produces confusion matrices, metrics, and predicted probabilities.
In this run, paired accuracy tests found differences for Random Forest and Logistic Regression, with McNemar p-values of approximately 0.0216 and 0.0002. The corresponding p-values for LightGBM and XGBoost were 1.0000. Each p-value comes from a separate test for one model and is not adjusted for running four comparisons. These tests concern paired classification errors; they do not directly establish the significance of the F1 changes or resolve upstream preparation questions.
We have not compared the results against threshold tuning or class weighting on the baseline data. Those comparisons would help assess whether simpler adjustments reach a similar operating point.
Proof kit: UCI Polish Companies Bankruptcy
ZIP · 31.5 MB · 4 model folders
- Before and after datasets for each model
- A standalone
run_model.pyscript per model - Split information that identifies the original evaluation records
Reruns model training and scoring; it does not rerun the upstream preparation steps. Data: Tomczak, S. (2016), UCI Polish Companies Bankruptcy, CC BY 4.0, prepared derivatives.
What this means for bankruptcy prediction
On this UCI-derived evaluation set, Syntitan’s additional data preparation raised Random Forest F1 from 0.4091 to 0.6098 without changing its model settings. Logistic Regression improved both precision and recall, while XGBoost achieved the highest final F1 among the four models.
The useful outcome is a model-by-model view of what changed: additional detections, false positives, and ranking performance. Syntitan’s comparison and exported Proof Kit provide evidence teams can inspect before deciding which preparation approach deserves further testing.
This experiment measures historical classification performance. It does not measure lending outcomes, avoided losses, investment returns, or analyst time saved.
Related experiments with the same before-and-after setup: UCI Bank Marketing dataset and UCI Iranian Churn dataset.
Try it on your data. Syntitan Ready for Model runs the same kind of comparison: the same model settings, before and after data preparation, scored on the same evaluation records, with exported files for rerunning model training and scoring.
Dataset attribution: Tomczak, S. (2016). Polish Companies Bankruptcy. UCI Machine Learning Repository. doi:10.24432/C5F600. Licensed under CC BY 4.0. This experiment uses a processed derivative.