
A plant team wants to use equipment data to flag failure risk ahead of scheduled maintenance. Before it evaluates any early-warning model, it needs to know whether its failure labels can be trusted.
Predictive maintenance uses equipment data, such as temperature, speed, torque and tool wear, to estimate when a machine is likely to fail so that maintenance can happen before the failure. A predictive maintenance model is only as reliable as its failure labels: the records that say which events count as a failure, and when.
CUBIG examined the public UCI AI4I 2020 Predictive Maintenance Dataset in November 2026. The dataset is synthetic, built to reflect real predictive maintenance data, and it has no missing values. Of its 10,000 records, 339 are labeled as machine failures, 3.39%. Yet in 27 records, the failure label does not match the failure-mode flags.
AI4I has no timestamps or forecast window, so it tests whether a model can classify a failure from the operating conditions in the same record, not how far in advance a failure can be predicted.
Complete data is not always model-ready: UCI AI4I 2020, 10,000 records
0
missing values
27
records where the failure label and the failure-mode flags do not match
3.39%
records labeled as failures
CUBIG then ran the same data through Syntitan’s Ready for Model. On 2,000 held-out records with 68 actual failures, the model with the highest F1, LightGBM, found 49 failures before data preparation and 56 after, with false alarms moving from 3 to 4. The run, its limits and what it means for a maintenance team are below.
Key takeaways
- Check the failure labels before the sensors. A complete file can still disagree with itself about what a failure is.
- Failures are rare, so accuracy says little. A model that always predicts “no failure” would be right 96.61% of the time on this data.
- Compare versions on the same held-out records and count missed failures and false alarms, not only a score.
- Remove fields recorded with or after a failure before training, or the model learns the answer instead of the warning signs.
- Results on a synthetic dataset show how a check works, not how much a real plant will gain.
What does predictive maintenance data need to contain?
Predictive maintenance data needs readings that come before a failure, a failure label tied to a time, and a record of what maintenance changed. Sensor values alone cannot teach a model anything unless some records say which readings led to a failure.
A typical training table for a failure model holds:
- Operating conditions: temperatures, rotational speed, torque, load or vibration, recorded at regular intervals.
- Usage counters: tool wear time, cycles or hours since the last service.
- Failure labels: whether a failure occurred, and ideally which kind, on a clear time basis.
- Maintenance events: replacements, repairs and inspections, which reset counters and change what the next readings mean.
The AI4I file (2020) has columns for the first three, but no timestamps: air and process temperature, rotational speed, torque, tool wear, a machine failure label and five failure-mode flags. It has no separate maintenance log.
Maintenance is a large cost line, though the payoff of predictive maintenance is hard to pin down. A NIST report on the costs and benefits of advanced maintenance (2018) notes that published estimates put maintenance at between 15% and 70% of the cost of goods sold, and that the effect of predictive maintenance on costs is not well documented at the national level.
CUBIG Shorts
Enough for a Monthly Summary, Not for Predicting Failures
A short take on the same point: service records that summarize last month may still lack the examples a failure prediction needs.
Why can a clean sensor file still have the wrong failure labels?
A sensor file can be complete and still disagree with its own definition of a failure. UCI’s description of the 2020 AI4I dataset says machine failure consists of five failure modes, and that the label is set to 1 if at least one of them is true.
In CUBIG’s 2026 analysis of the file, the label and the flags do not match that description for 27 records:
- 18 records carry a random failure (RNF) flag but a machine failure label of 0.
- 9 records carry a machine failure label of 1 with no failure-mode flag at all.
The random failure flag is the main source. It appears 19 times in the file, while UCI’s description says random failures occur for only 5 data points. Only 1 of the 19 flagged records is labeled as a failure.
CUBIG’s counts come from its own pass over the original file, and anyone can reproduce them with a few lines of code:
# reproduces CUBIG's 2026 label check on the UCI AI4I file
import pandas as pd
df = pd.read_csv("ai4i2020.csv")
flags = df[["TWF", "HDF", "PWF", "OSF", "RNF"]].sum(axis=1)
print(((df["Machine failure"] == 0) & (flags > 0)).sum())  # 18
print(((df["Machine failure"] == 1) & (flags == 0)).sum())  # 9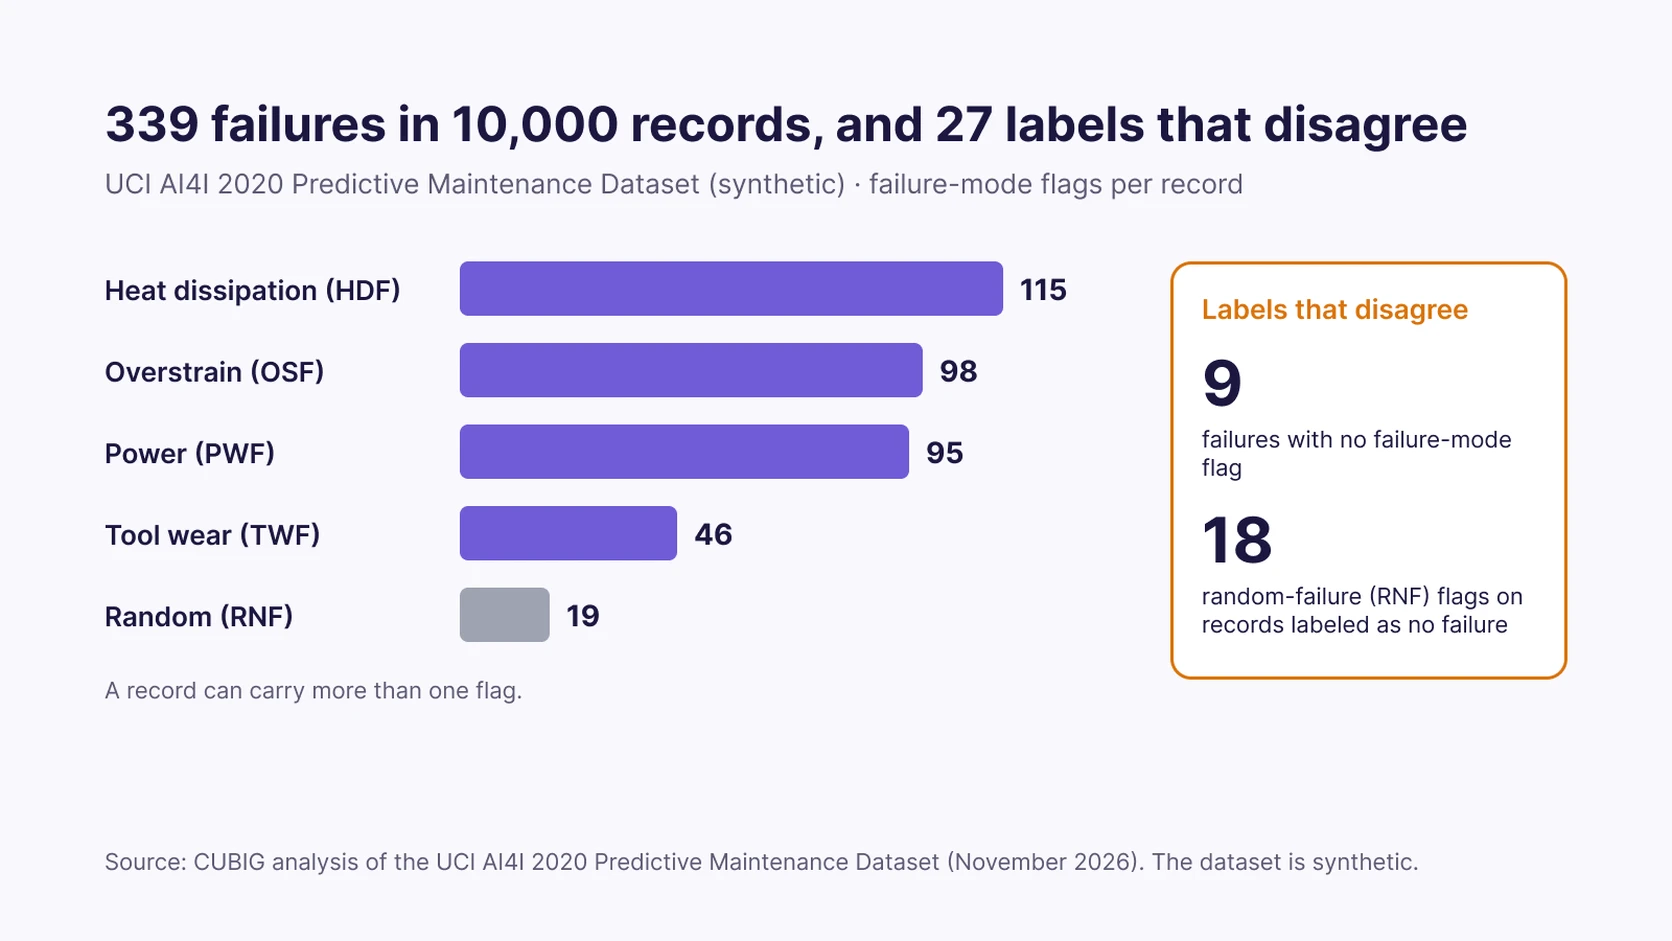
None of the 27 records has a missing value, so a completeness check passes. A team that trains on the label as given is teaching the model one definition of failure while the flags describe another. The fix is not statistical: someone who knows the process decides what counts as a failure, writes the definition down, and checks every label against it before training.
How rare are failures, and what does that do to accuracy?
Failures are usually a small share of maintenance data, and rarity makes accuracy a weak measure. In CUBIG’s analysis of AI4I, 96.61% of records are not failures, so a model that never predicts a failure would score 96.61% accuracy and catch nothing.
In CUBIG’s Syntitan run, LightGBM’s accuracy before data preparation was already 98.9%, while it missed 19 of the 68 failures in the evaluation records. Recall, the share of actual failures the model finds, and precision, the share of its alerts that are real, say far more. The scikit-learn example on precision-recall describes precision-recall as a useful measure of success when classes are very imbalanced. The precision-recall curve entry in CUBIG’s glossary explains how to read one.
What did CUBIG’s Syntitan run on the AI4I data show?
In CUBIG’s 2026 run, data preparation raised every model’s F1 on the same 2,000 evaluation records, but the size of the gain and its trade-offs differed by model. CUBIG uploaded seven columns: product quality type, air and process temperature, rotational speed, torque, tool wear and the machine failure label.
The five failure-mode flags were left out before upload. Those flags describe the failure itself, so a model given them would learn the answer rather than the failure patterns in the operating conditions. Syntitan’s Ready for Model then scored four built-in models before and after its own preparation, on the same held-out records, which the run report shows as 2,000 of the 10,000, identical for both versions.
In CUBIG’s 2026 run, the 27 records whose labels disagree were uploaded as they were, without removing or correcting them, so the comparison does not include label cleanup. Ready for Model’s Proof Kit exports the split information and run scripts so the comparison can be rerun.
| Model | F1 before | F1 after | Failures found (of 68) | False alarms |
|---|---|---|---|---|
| LightGBM | 0.8167 | 0.8750 | 49 → 56 | 3 → 4 |
| XGBoost | 0.8065 | 0.8480 | 50 → 53 | 6 → 4 |
| Random Forest | 0.7288 | 0.8504 | 43 → 54 | 7 → 5 |
| Logistic Regression | 0.2000 | 0.4659 | 8 → 58 | 4 → 123 |
For LightGBM, the seven newly found failures came with no failure lost: every failure found before preparation was still found after. Recall rose from 72.1% to 82.4%, while precision moved from 94.2% to 93.3% because one more record was flagged by mistake. Syntitan reports four preparation steps for that model:
- new columns combining existing ones, such as torque per rotational speed and the difference between process and air temperature, 20 in total
- product quality type converted to the share of training rows of that type that failed
- a transformation that reduces skew in value distributions
- columns that place each value in one of 10 ranges
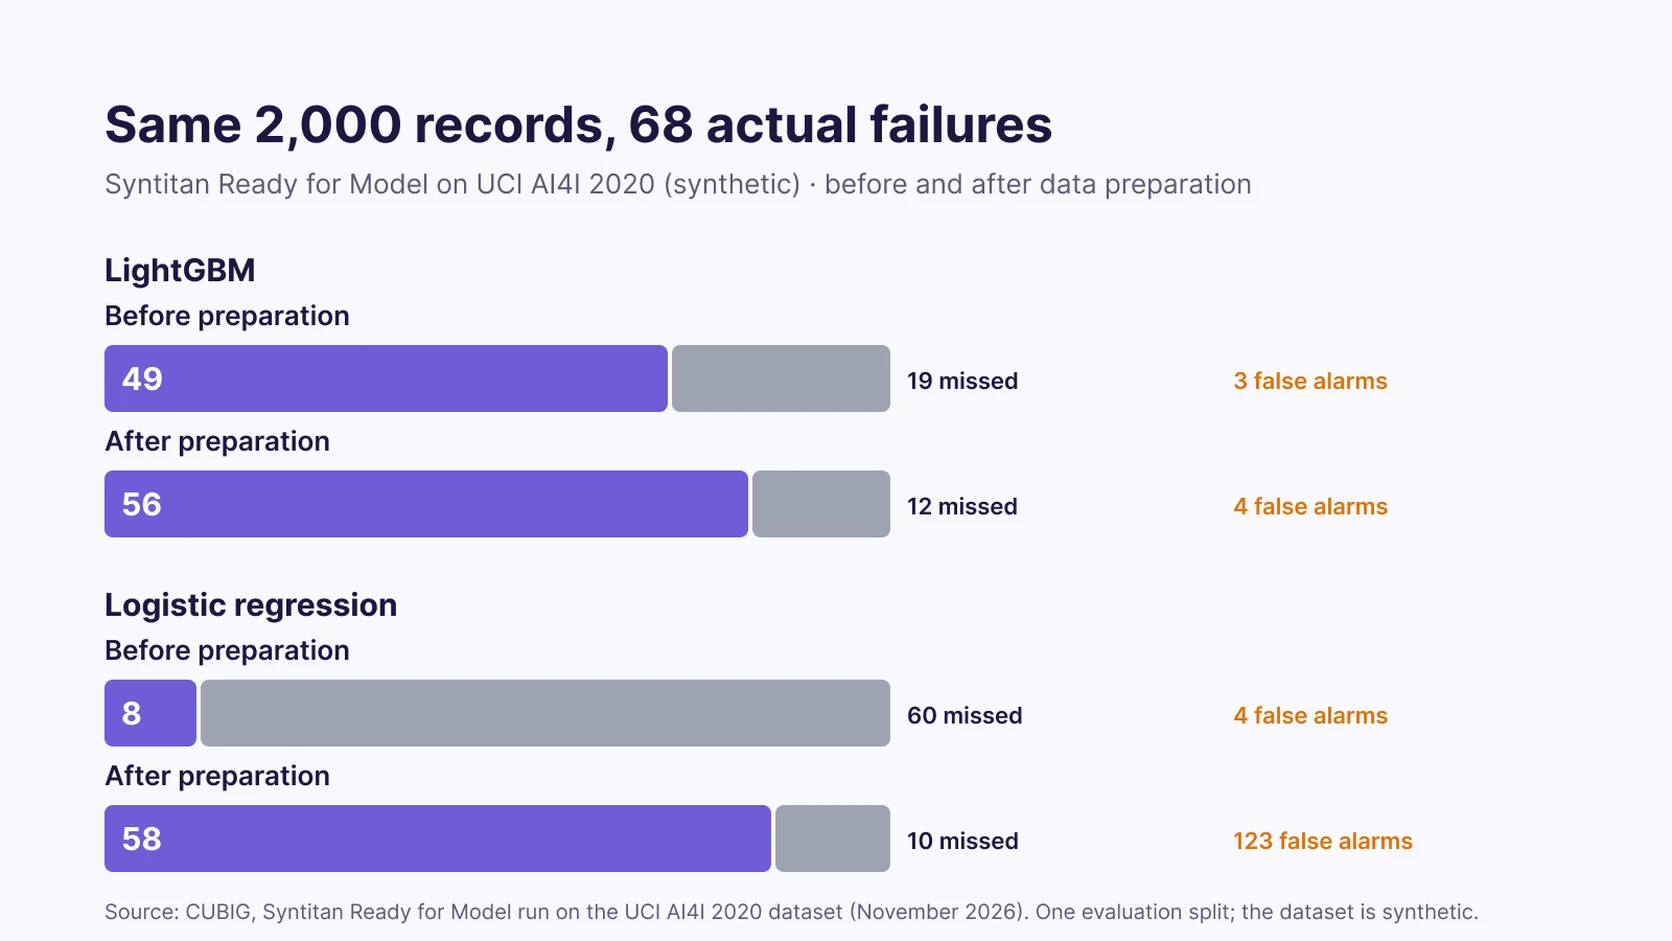
Logistic regression shows why a single score can mislead. Its F1 more than doubled, and it found 58 of the 68 failures instead of 8. It did so by raising 123 false alarms instead of 4, so a team acting on its list would inspect many machines that were fine.
Why did preparation help here, and would it help in a real plant?
According to UCI’s description, AI4I’s failure modes are defined by rules on quantities that resemble the columns Syntitan generated, which may be one reason preparation helped here. UCI’s description defines heat dissipation failure by the difference between air and process temperature together with rotational speed, power failure by the product of torque and rotational speed, and overstrain failure by tool wear multiplied by torque.
One generated column, the temperature difference, is a quantity in UCI’s heat dissipation rule; torque per rotational speed is a ratio, while UCI’s power rule uses the product. The run does not show which generated column mattered most, and it does not show that the same steps would help on data from a real line, where failure rules are not written down in advance.
The run has further limits. It used one evaluation split of 2,000 records, so 68 failures carry each result, and with 68 failures a change of a few detections could shift under a different split; the run did not test other splits. The data is synthetic. The preparation steps listed above are the ones Syntitan reported for LightGBM, and other models may have been prepared differently. The file also has no timestamps, so input timing could not be checked.
How should a maintenance team read a failure model’s results?
A maintenance team should read a failure model as a list it will act on: how many failures the list catches, how many good machines it sends to inspection, and what each of those costs. A missed failure can mean downtime, scrap or a safety incident; a false alarm means an inspection or an early part change.
| Situation | What to prioritize | Why |
|---|---|---|
| Unplanned stops are very costly | Recall | A missed failure costs more than an extra inspection |
| Inspection crews are limited | Precision at the volume the crew can handle | Only the top of the list gets checked |
| Failures have different causes | Results by failure type | A model can catch one mode and miss another |
| Data comes from several lines or sites | Results by line or site | A model trained on one line may not hold on another |
The cost of staying reactive shows up in survey data. A NIST survey-based analysis of U.S. manufacturers (2020) found that the quarter of establishments relying most on reactive maintenance was associated with 3.3 times more downtime and 16.0 times more defects than the quarter relying on it least. Those are associations from survey data, not a measured effect of any single model.
Where does Syntitan fit in predictive maintenance?
Syntitan checks whether a team’s maintenance data supports a specific failure-prediction task and shows what preparation changes, under the same evaluation conditions. Syntitan, CUBIG’s AI-ready data platform, does this in two ways that answer different questions and do not have to run in order.
Ready for Raw Data diagnoses a dataset on six axes and proposes fixes, such as correcting formats and values or choosing how to handle missing readings, with the original kept unchanged and each result saved as a Version.
Ready for Model takes a yes-or-no question, such as whether a record ends in failure, and compares four built-in models before and after automatic preparation on the same evaluation records. It leaves ID-like key columns and columns it identifies as giving away the answer out of the model inputs, reports missed and newly found cases, and exports a Proof Kit with the data and run scripts. Datasets can have 100 to 10,000 rows, which is why all 10,000 AI4I records fit without sampling.
CUBIG’s Proof page states the same principle for its operational evidence: same model, same criteria, only the data changed.
Syntitan does not replace condition-monitoring or maintenance management systems, and it does not deploy a failure model. It works on the data those systems already collect and checks, before a model is built, whether that data supports a failure-prediction task. Ready for Model currently supports yes-or-no prediction, and data connectors are in preparation. Deciding what counts as a failure, and what a missed failure costs, stays with the maintenance team.
What should a team check before acting on failure predictions?
Before a failure model changes a maintenance schedule, a team should be able to answer these questions from evidence.
- Failure definition: is there a written definition of a failure, and do the labels match it record by record?
- Timing: were all inputs available before the failure, with flags and repair notes recorded afterward left out?
- Rarity: how many failures are in the evaluation records, and is the result read as recall and precision, not accuracy?
- Same conditions: were both versions scored on the same held-out records?
- Trade-off: how many more failures does the new version catch, and how many more good machines does it flag?
- Coverage: does performance hold for each failure type and each line or site?
- Evidence: can the team name the data version, the preparation applied and the run behind the result?
A predictive maintenance model inherits the strengths and the mistakes of its failure labels. Teams that settle what counts as a failure, and keep the evidence of each comparison, can tell a real improvement from a longer list.
Try it on your data in Syntitan: compare your failure data before and after preparation on the same evaluation records, or open the Manufacturing example among Syntitan’s industry examples first.