
A founder building a small company’s first AI feature wants to know which customers will leave. The product offers model, agent or source data as starting points, and sorting the task into one of those is already a second problem.
Customer churn prediction is the use of a company’s own customer records to flag which customers are likely to leave before they do. A team without a data specialist still has to decide which question the model answers, which fields count as inputs, which rare cases to add and how many wrong flags the follow-up work can absorb.
Adapted from AI Data Preparation: Why First-Time Users Still Get Stuck by Minchan Chung, Co-Founder and Co-CEO of CUBIG, on the CUBIG Tech Blog (November 2026).
The gap between large companies and small ones shows up in adoption figures. In the U.S. Census Bureau’s Business Trends and Outlook Survey (collection ending May 3, 2026), 37% of firms with at least 250 employees reported using AI in their business operations, while fewer than 20% of firms with four or fewer employees did. CUBIG’s own bank marketing experiment (October 2026) shows the preparation work that sits between the question and the model, the work a data team would otherwise absorb.
Key takeaways
- A churn model answers one question at one moment. “Who should we contact this week?” and “Why did last quarter’s customers leave?” need different input fields, even on the same records.
- Fields that only exist after the decision, such as the length of a call that has not happened yet, lift test scores and are not available when the flag is needed. The UCI Bank Marketing documentation says this about its own call-duration field.
- Preparation work (choosing fields, adding rare examples, comparing before and after) is specialist work. A small team has to see its results without first learning each method.
- More customers found usually arrives with more customers wrongly flagged. Whether that trade is worth it depends on what a follow-up costs, which only the business side knows.
What does customer churn prediction produce?
Customer churn prediction produces a score for each customer and a cut-off that turns the score into a flag. The flag is a classification: this record looks like the records of customers who left. The model does not know why they left, and the flag is only as good as the records it learned from and the evaluation records it was tested on, as in any AI model evaluation.
Teams with a data function may not notice the decisions behind that flag. A data team picks the records, prepares the fields, makes the technical choices and hands a result to whoever owns retention. The experience feels easy because somebody else did the difficult part. A solo builder, or a small agency handling a client’s data, has nobody in that seat.
Which question should a team answer first: the business question or the specialist one?
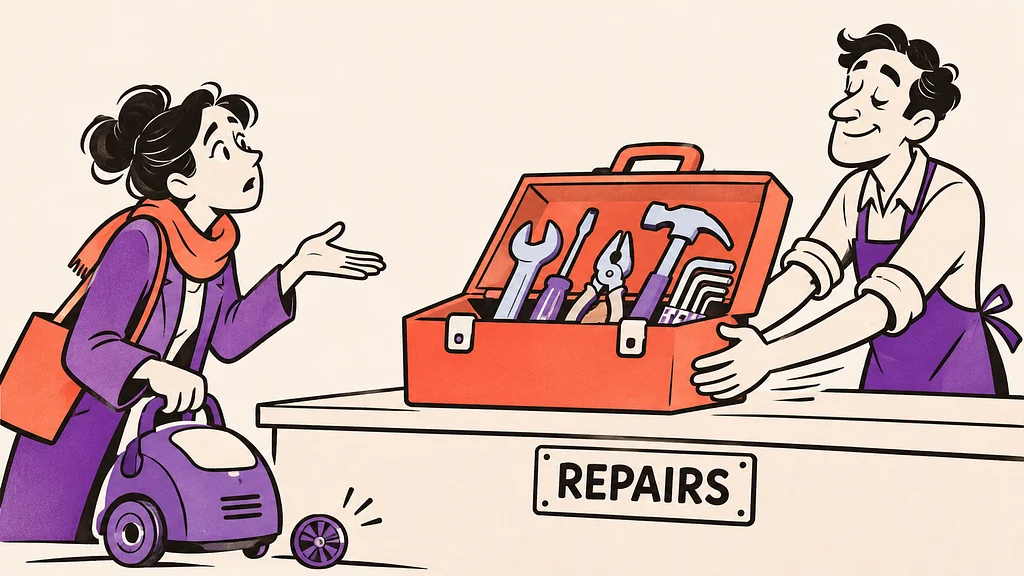
Two kinds of question appear at the start of churn work, and putting both in the same dropdown does not make them equally easy. “Which method should we use to create more examples of customers who left?” requires knowledge of data generation methods. “Are you choosing whom to contact before a call, or analysing records after the call?” asks the person to describe their own work. The second question is the one the business side can answer.
The answer decides which fields are allowed. The UCI Bank Marketing dataset documentation says of its call-duration field that it “should be discarded if the intention is to have a realistic predictive model”, because the duration is not known before a call is made. A churn model that scores customers before an outreach call cannot use anything the call produces. A model that explains last quarter’s losses can.
In an interview study of four data scientists, Vogelsang and Borg (2019) concluded that the people writing requirements for machine-learning systems need to understand the model’s performance measures to state good functional requirements. For a team without that person, the product has to carry the translation from “whom do we contact” to “which fields and which measure”.
What specialist work sits between the question and the churn model?
CUBIG’s bank marketing experiment (October 2026) shows the work that follows once the question is settled. The software selected the fields used for training, added examples of the less common customers who had signed up for a term deposit, and compared the results with training on the original records. The comparison measured field selection and added examples together, not separately. The run left behind the prepared training data, the comparison results and the code to rerun the comparison.
On one evaluation split of 824 records (CUBIG, October 2026), with the same random forest settings, the model trained on prepared data correctly identified 56 customers who had signed up instead of 31, and wrongly flagged 39 customers instead of 16. Because the inputs included call duration, the run was a classification of completed calls, not a forecast of whom to call next, and it did not show more subscriptions or better selection of people to contact.
A churn model has the same moving parts: rare cases to find, wrong flags to count, and a scope that the input fields define.
Each of those steps has a method behind it, and the five experiments CUBIG ran on public datasets show that the same preparation raised F1 in 16 of 20 model-and-dataset comparisons, left it unchanged in 4, and lowered precision on three datasets. A team cannot skip the steps, but a small team should not have to write the code that adds training examples before it can see whether the result moved.
CUBIG Shorts
Enough for a Monthly Summary, Not for Predicting Failures
A short take on the specialist step above: cleaning a file helps, but it won’t create the missing examples a prediction task needs.
How should a team judge more customers found against more wrong flags?
Every churn flag comes from a cut-off. Google’s Machine Learning Crash Course describes the mechanism: as the classification threshold rises, the model will likely predict fewer positives overall, both true and false, and a threshold of 0.5 is “not a good idea if the cost of one type of wrong classification is greater than the other, or if the classes are imbalanced”. In churn work the customers who leave are the smaller class, and the two costs are seldom equal.
CUBIG’s Iranian telecom churn experiment (October 2026) shows the trade in churn terms. With unchanged logistic regression settings and the default 0.5 threshold, the model trained on prepared data found 78 of the 99 churners in the same 630 evaluation records instead of 42, while non-churners wrongly flagged rose from 8 to 41. The run used one train/test split and measured prediction, not whether contacting those customers kept them.
Thirty-six more churners found and thirty-three more wrong flags can be a good trade for a retention email and a poor trade for a discount that costs margin. The judgement needs knowledge of the work: what a follow-up costs, how many follow-ups the team can handle this week, whether a missed churner costs more than a wasted call, and which customers the team would have contacted anyway. A score going up is one input to that decision, as the business rules the model never saw are another.
What does a team without a data specialist still have to decide?
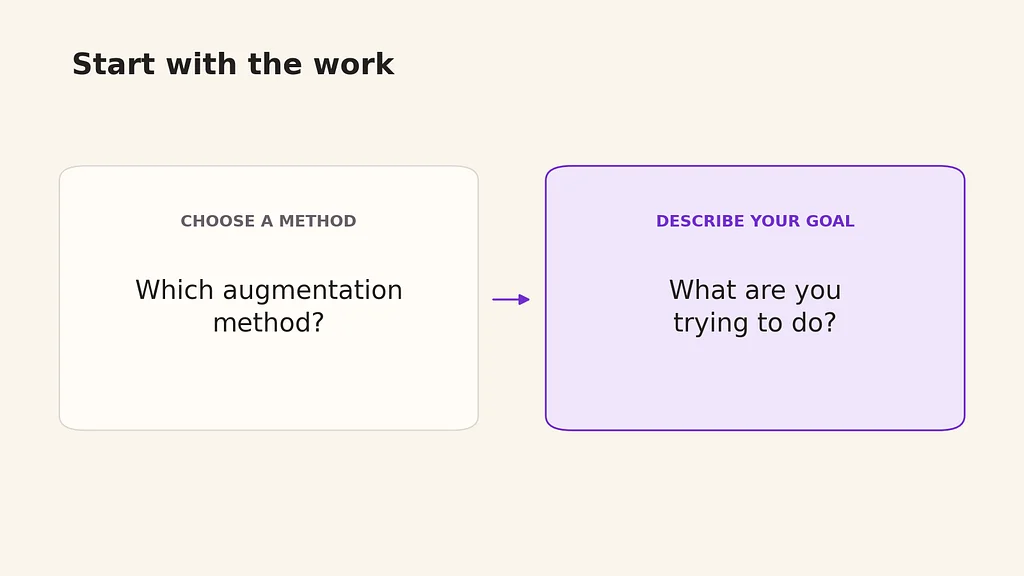
Four decisions stay with the business side regardless of who runs the model. Each one is a sentence a retention owner can write without a data background, and each one changes the data preparation that follows.
| Decision | A sentence the business side can write | What it changes in the data preparation |
|---|---|---|
| Which moment the flag is used | “We score customers every Monday before the retention team calls.” | Removes every field created after that moment (call length, call outcome, survey answers, cancellation reason) from the inputs. |
| Which customers count as churned | “A customer who has not ordered in 90 days and has no open contract.” | Defines the label the model learns, and therefore which past records become the rare examples to add. |
| What a wrong flag costs | “A wasted call costs 20 minutes; a wasted discount costs margin.” | Sets how far the cut-off can move toward catching more churners before the extra wrong flags stop paying off. |
| What a missed churner costs | “A lost enterprise account is worth a year of calls.” | Justifies accepting more wrong flags when the class is small, and tells the comparison which side of the result matters more. |
A quick check before any churn model goes into use:
- Can the team name the moment the flag will be used, and does every input field exist at that moment?
- Do the records of customers who left reflect the customers the team wants to catch next, or are they too few to learn from?
- Was the model compared before and after preparation on the same evaluation records, with both the extra hits and the extra wrong flags reported?
- Has someone priced a wrong flag and a missed churner in the team’s own follow-up process?
- Can the team rerun the comparison when the data changes next quarter?
What does Syntitan keep of the specialist work?
CUBIG built Syntitan, its AI-ready data platform, so that the specialist steps and their results sit in one project on a copy of the company’s records. Ready for Raw Data checks the data state on six axes, among them usability, integrity and consistency. Ready for Model compares results from the original and the prepared data under the same evaluation conditions and reports both sides of the result, the extra hits and the extra wrong flags.
The comparison makes the trade-off above visible before anyone acts on a flag. DTS, CUBIG’s data enablement product, supplies the added examples of rare cases when a churn class is too small to learn from.
The original dataset stays untouched, and the prepared copy, the comparison results and the evaluation conditions are recorded against the project version, so when a second task on the same customers comes up next quarter the team can see what the earlier model was trained and tested on. What the software does not do is make the business decisions for the team. A product can show that a prepared file found more churners and flagged more by mistake; whether that is acceptable, and at which moment the flag is used, remains the team’s call. Try it on your data.