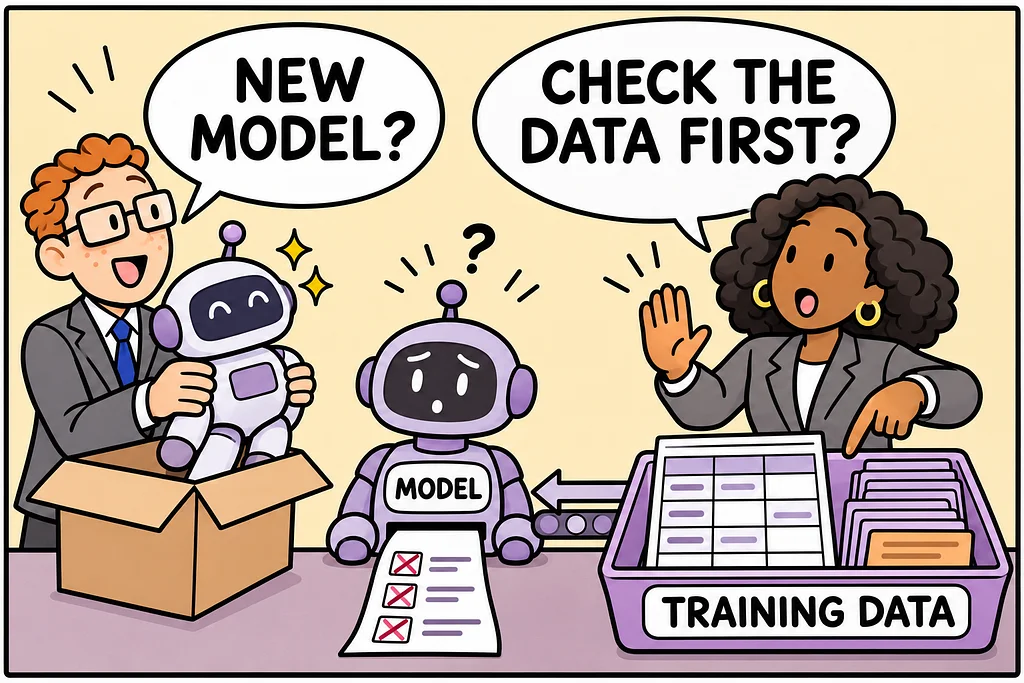
A churn model misses most of the customers who leave, and the team starts comparing newer models. Nobody has yet checked whether a different preparation of the same training data would change the result.
Data preparation for machine learning is the work of turning existing records into training data that fits one task, such as selecting fields, deriving features or adding examples of a rare outcome, and is best judged by checking on fixed evaluation records whether the prepared data changed the model’s result.
Adapted from Hold the Model Still by Bogum Yoo, COO of CUBIG, on the CUBIG Tech Blog (November 2026).
Across five public UCI datasets in CUBIG’s experiments (October 2026), each of four models was trained twice with the same settings: once on the baseline training data and once on training data prepared in Syntitan for that task. Both versions were scored on the same evaluation records at a 0.5 decision threshold. F1 improved in 16 of the 20 comparisons and did not change in 4.
Key takeaways
- Holding the model settings and the evaluation records fixed is what lets a change in results be linked to how the data was prepared.
- In all four comparisons highlighted below, F1 rose while false alarms grew, so whether the data is ready depends on the task’s acceptance criteria.
- The results come from public datasets and single train and test splits. They are a reason to test data preparation on your own task, not evidence about customer data.
What is data preparation for machine learning?
Data preparation for machine learning shapes data for one task. Typical steps include choosing which input fields the model may use, deriving new features from existing ones, and adding examples of the outcome that matters when it is rare in the data, such as bankruptcies, churned customers or diseased trees.
Preparation goes beyond data cleansing. Cleansing corrects values that are wrong or missing. Preparation decides what the training data should contain for a specific model and task, so the same dataset can need different preparation for different tasks, as AI data preparation starts with the task explains.
How do you test whether data preparation improved a model?
A preparation step is only worth keeping if the result meets the task’s criteria better than before. The five experiments used the same five checks, which any team can repeat on its own data.
- Fix the model settings. Train the same model with the same settings on the baseline and the prepared training data, so the model is not the change being measured.
- Fix the evaluation records. Score both versions on the same evaluation records, kept apart from training.
- Fix the decision threshold. The experiments kept the threshold at 0.5 in every before-and-after comparison.
- Apply learned transformations consistently. Feature transformations set during preparation were also applied to the evaluation inputs, as any model in use would need.
- Read more than one metric. Compare F1 with recall, precision and the number of false alarms, and read the result against the task’s criteria.
The five checks follow the same logic as any AI model evaluation: a comparison means something only when everything except the change being tested stays fixed.
What did five data preparation experiments show?
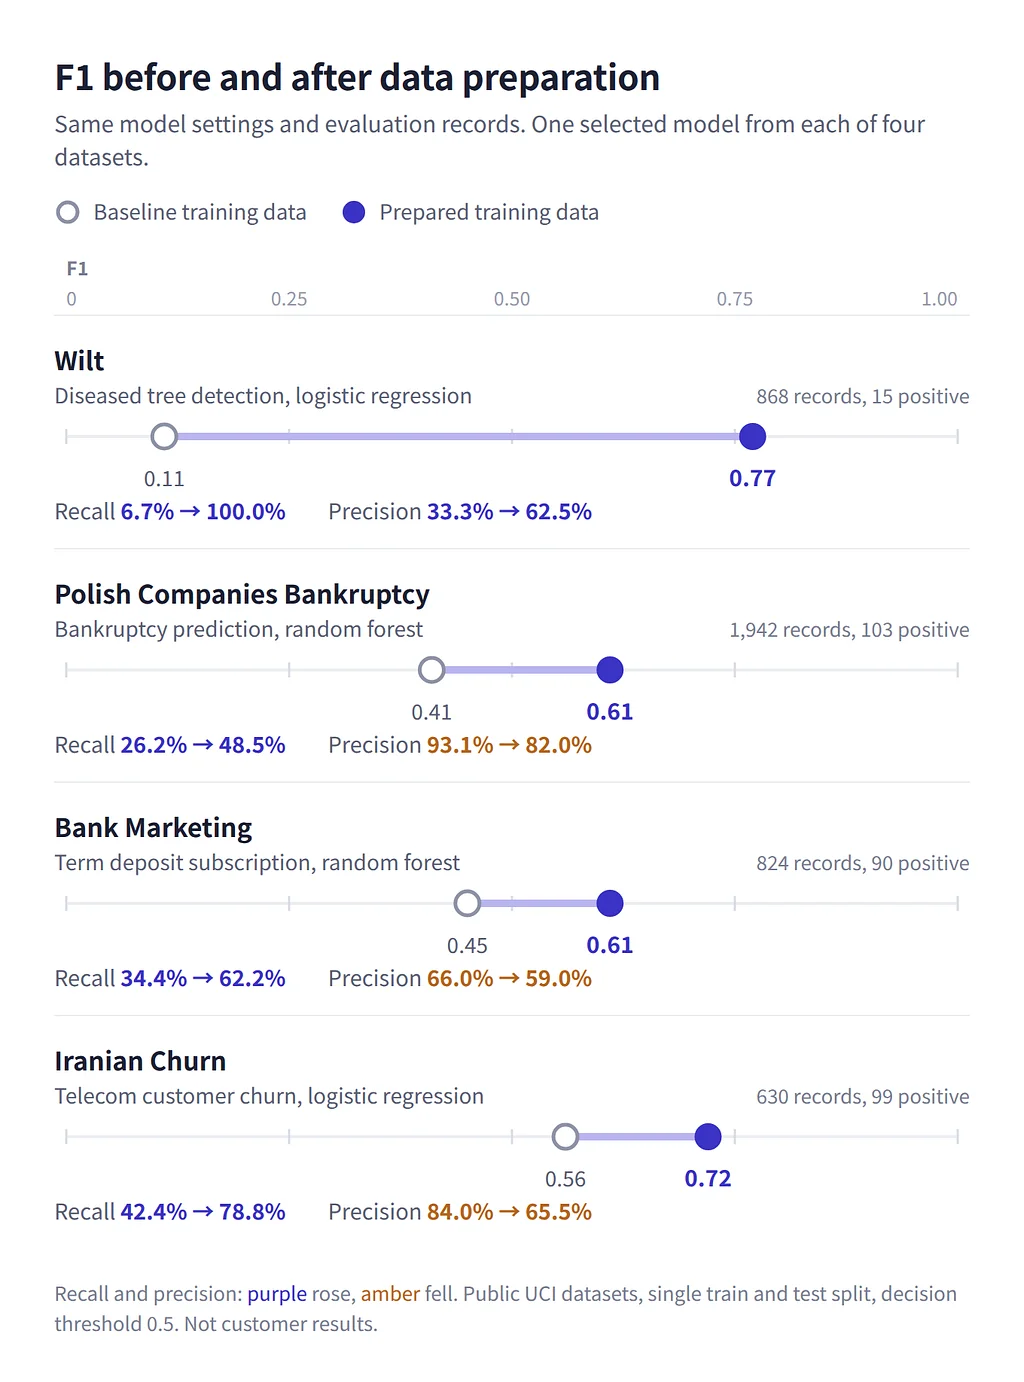
Across 20 model and dataset comparisons, F1 improved in 16 and did not change in 4. Three of the four unchanged results came from cases where Syntitan adopted no additional preparation, so the data before and after was the same. The first chart shows one selected model from each of four datasets, with the details in each experiment write-up: Wilt, Polish Companies Bankruptcy, Bank Marketing and Iranian Churn.
| Dataset and task | Model | F1 | Recall | Precision | Evaluation records |
|---|---|---|---|---|---|
| Wilt: diseased tree detection | Logistic regression | 0.11 to 0.77 | 6.7% to 100.0% | 33.3% to 62.5% | 868, 15 positive |
| Polish Companies Bankruptcy | Random forest | 0.41 to 0.61 | 26.2% to 48.5% | 93.1% to 82.0% | 1,942, 103 positive |
| Bank Marketing: term deposit subscription | Random forest | 0.45 to 0.61 | 34.4% to 62.2% | 66.0% to 59.0% | 824, 90 positive |
| Iranian Churn: telecom customer churn | Logistic regression | 0.56 to 0.72 | 42.4% to 78.8% | 84.0% to 65.5% | 630, 99 positive |
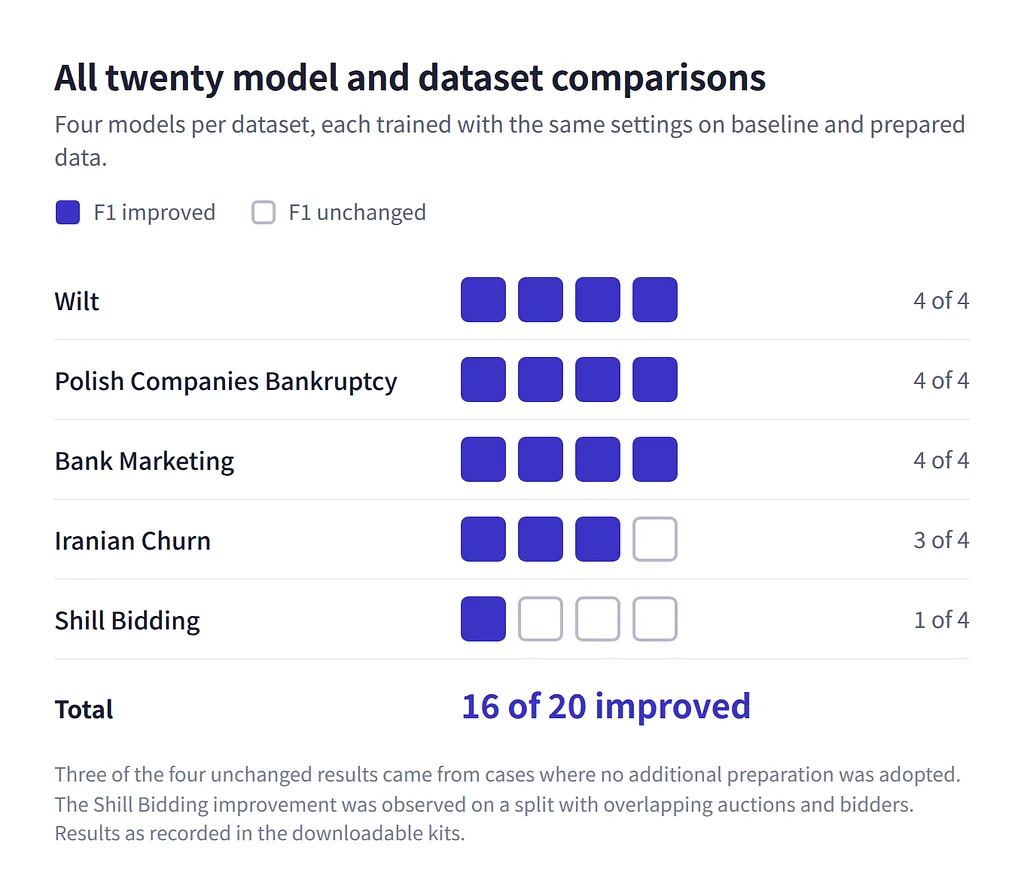
The preparation itself differed by model and by dataset. Random forest on Polish Companies Bankruptcy got 20 derived features and augmented positive training records. Random forest on Bank Marketing used 15 of 20 input variables and 897 added positive training cases. Logistic regression on Iranian Churn got new features and an augmented minority class, adding 515 training rows. Shill Bidding is left out of the chart: its logistic regression improvement was observed on a split with overlapping auctions and bidders, and identifier-feature ablation remains outstanding.
Why did false alarms rise when F1 improved?
In all four highlighted comparisons, the number of false alarms grew. Precision fell on Polish Companies Bankruptcy, Bank Marketing and Iranian Churn. On Wilt, precision rose, but the model also flagged more segments that were not diseased. At the fixed 0.5 threshold, each retrained model flagged more records, trading precision for recall; per the Polish write-up, the higher F1 reflects a shift in the operating point.
The Polish Companies Bankruptcy write-up (October 2026) shows the trade-off. The baseline random forest was precise but missed most failures, with precision of 93.1%, recall of 26.2% and F1 of 0.41. With the model settings unchanged, the prepared data raised F1 to 0.61 and recall to 48.5%. Teams often reach for more tuning or a different model at that point; these results support testing data preparation alongside threshold tuning and class weighting, although the experiments did not compare those approaches.
The right trade-off depends on the work. A screening team may want fewer missed cases, while a team with limited review capacity may not be able to handle more flags. The experiments did not measure those costs; they show the trade-off a team would have to judge against its own acceptance criteria.
What do these experiments not show?
The experiments are small and controlled, and their limits are part of the result.
- The datasets are public. The results are not customer results, and enterprise data may behave differently.
- Each result comes from a single train and test split. Rerunning the script reproduces that split; stability across splits or random seeds has not been tested.
- The Wilt evaluation set has 15 positive segments, so recall of 100% means all 15 were found, and one miss would change recall by almost 7 points.
- Bank Marketing inputs include call duration, which is known only after a call ends, so the result is not performance for choosing whom to contact in advance. On that comparison, F1 rose while ROC-AUC and average precision fell.
- In the Shill Bidding split, training and evaluation records share auctions and bidders, so performance on unseen auctions has not been established.
How does CUBIG run a data preparation comparison?
The comparisons ran through Ready for Model in Syntitan, CUBIG’s AI-ready data platform. Syntitan works on a copy of the uploaded dataset, so the original stays as it was, and keeps the prepared result as a project Version.
Ready for Model prepares the training data for the chosen task, trains the model with the same settings on the baseline and the prepared data, and scores both on the same evaluation records. Each experiment write-up linked above includes a downloadable kit with scripts to rerun training and scoring; the kits do not rerun the upstream preparation steps.
A before-and-after result is evidence to weigh against the task’s criteria, not an automatic pass. Try it on your data.
All five datasets come from the UCI Machine Learning Repository and, per the repository, are licensed under CC BY 4.0. Prepared derivatives were used.