
An e-commerce team merges a year of orders to see which customers buy again. A quarter of the rows have no customer ID, and someone has to decide whether to fill them, drop them or leave them as they are.
Missing data in sales records is any field left empty, or filled with a placeholder such as “N/A”, in an order, invoice or transaction table. Handling missing data well means deciding, field by field, whether a gap can be estimated, must be flagged for someone to check, or should stay blank because the blank itself is true.
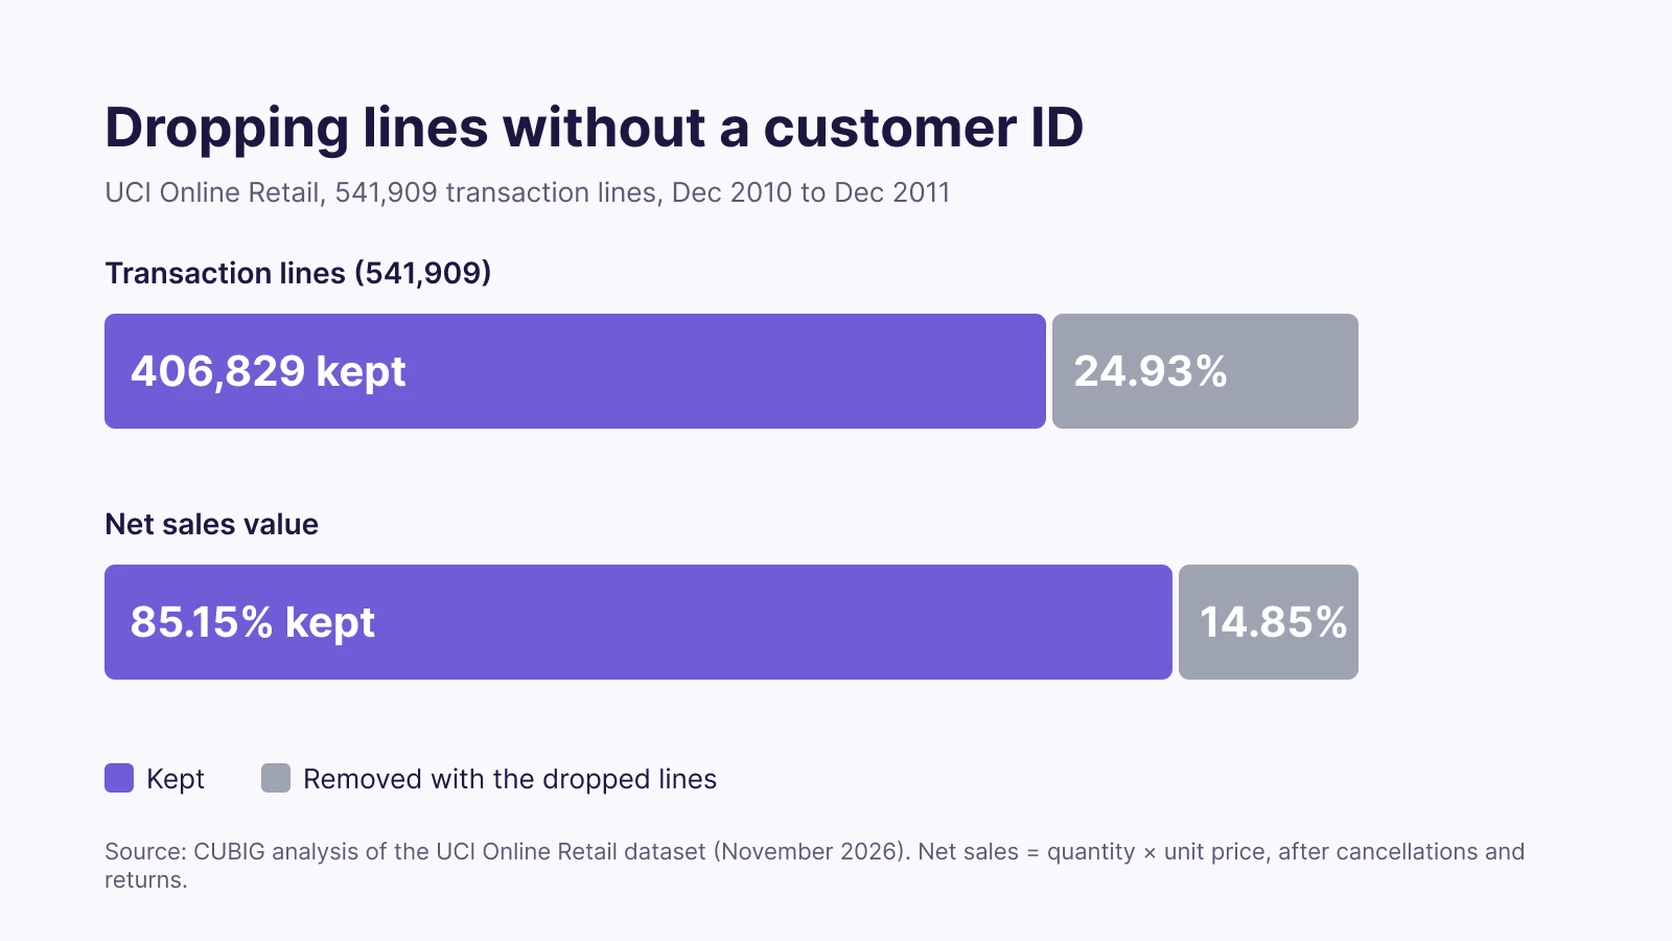
CUBIG analyzed the public UCI Online Retail dataset in November 2026: 541,909 transaction lines from a UK-based online retailer between December 2010 and December 2011. In the file, 135,080 lines, 24.93%, have no customer ID. The repository’s own metadata answers “No” to “Has Missing Values?”. A check that reads the description, not the file, would have missed the gaps in a quarter of the rows.
The rows without a customer ID are not a rounding error. In CUBIG’s analysis, the lines without a customer ID account for 14.85% of the file’s net sales value (quantity times unit price, after cancellations and returns). Dropping them makes the data fit a customer analysis and removes nearly 15% of the file’s net sales value at the same time. The figures describe one UK retailer’s 2010 to 2011 file, not a benchmark for retail data today.
Key takeaways
- Check the file, not the metadata. A dataset described as complete can still have large gaps.
- Decide by field and by task. The same blank can be filled for a model, flagged for finance and left alone in the customer record.
- Never estimate a value that someone outside the model will read as a fact, such as an order amount or a customer ID.
- Combining channel files can create new gaps. Check them after every union or join.
- Keep the original data and a record of each choice, so a filled value can always be told apart from an observed one.
What does missing data look like in sales records?
Missing data in sales records comes in several forms, and each form calls for a different response. A blank cell can mean the value was never captured, that the field does not apply, that someone typed a placeholder, or that combining two files left a gap.
- Not recorded: a guest checkout with no customer ID, or a marketplace order exported without the buyer’s region.
- Not applicable: an empty discount code because no discount was used, or an empty shipping date because the order has not shipped yet.
- Placeholder text: “N/A”, “none”, “-” or a 0 typed into a field that should be empty, which a missing-value count will not see.
- Created by combining files: a column that exists in the web shop export but not in the point-of-sale file, or a customer ID with no match in the customer table.
CUBIG’s analysis of the UCI Online Retail data (November 2026) shows how a blank can hint at what a row is. All 1,454 lines with no product description also have a unit price of 0 and no customer ID; 862 have a negative quantity and 592 a positive one. That pattern looks more like stock records than sales, but only someone who knows the retailer’s systems can confirm it, not an imputation method.
Why does the reason a value is missing matter?
The reason a value is missing decides whether filling it or dropping it will bias the result. Statisticians describe three cases, building on Donald Rubin’s 1976 paper Inference and Missing Data in Biometrika.
Stef van Buuren’s book Flexible Imputation of Missing Data explains them plainly. Data are missing completely at random (MCAR) when the probability of being missing is the same for all cases, such as a scale that ran out of batteries. Missing at random (MAR) means missingness depends on something the team can observe. Missing not at random (MNAR) means that, after the observed data are taken into account, missingness still depends on something unobserved, which can be the missing value itself. Van Buuren describes it as missingness that varies “for reasons that are unknown to us.”
Sales gaps are often not completely random. In the UCI file, 26.96% of lines from customers in the United Kingdom, the retailer’s home market, have no customer ID, against 3.19% of lines from other countries. Guest checkouts, phone orders or a particular sales channel can all produce blanks that cluster in one segment. Dropping those rows changes which customers and which countries the analysis sees.
Which sales values can be filled, which must be flagged, and which should stay blank?
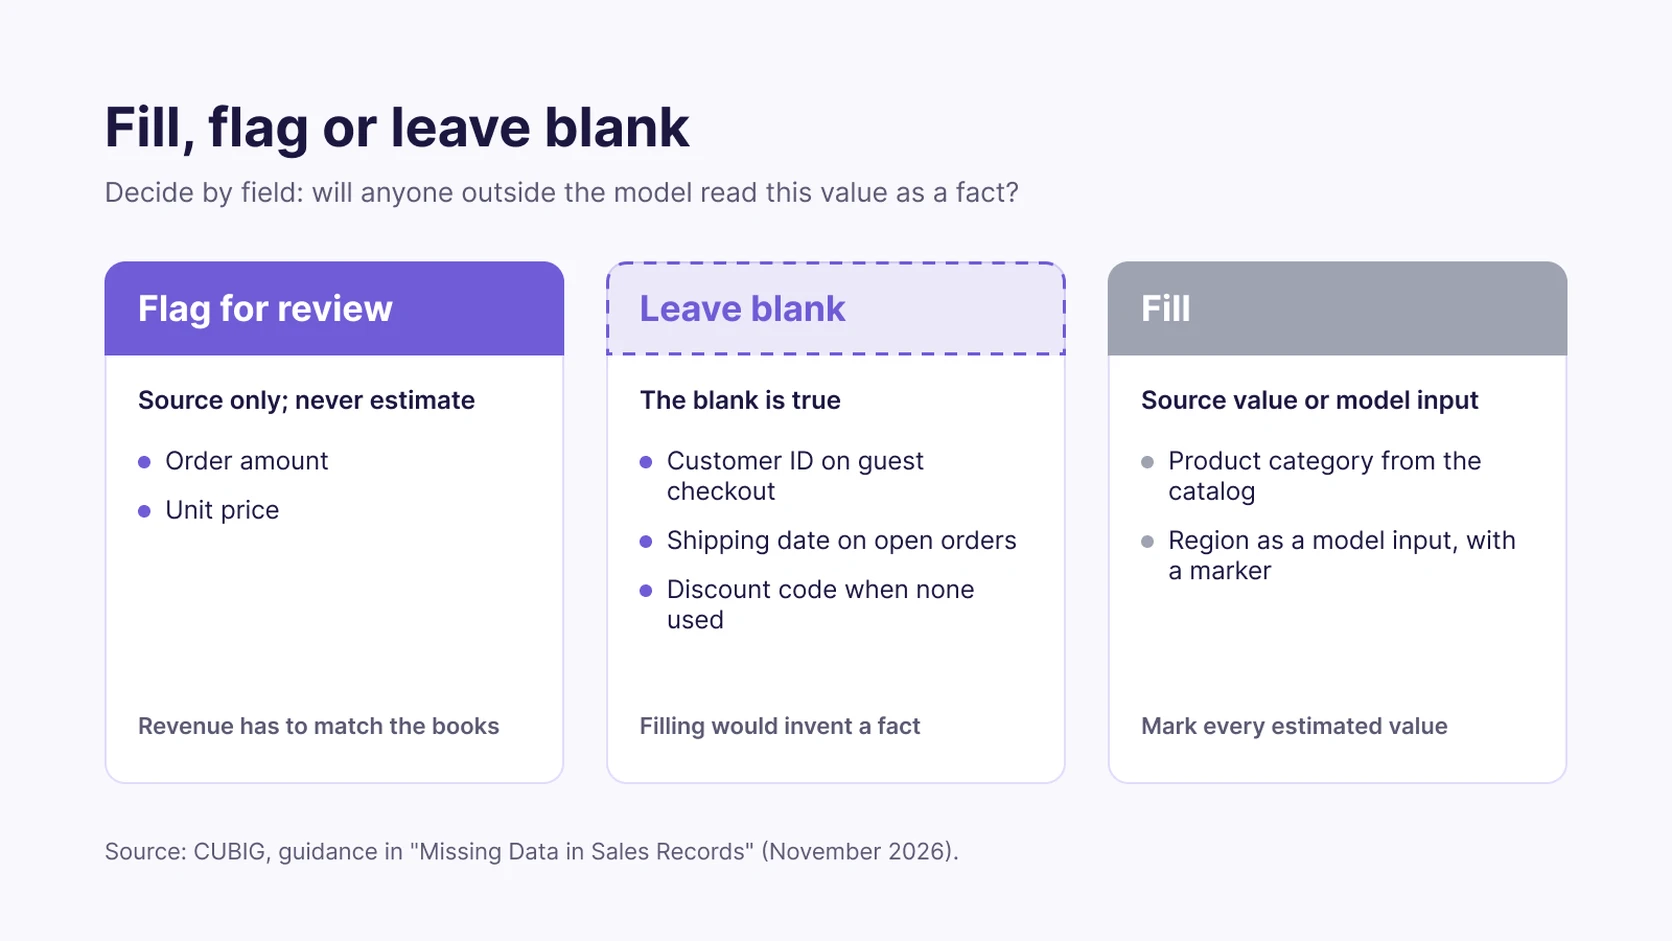
A simple rule separates the three: if anyone outside the model will read a value as a fact, do not estimate it. Finance reconciles order amounts, customers see their own records, and auditors check invoices. Model inputs are different, because a filled value there is one input among many and can be marked as estimated.
| Field | Typical gap | Recommended handling | Why |
|---|---|---|---|
| Order amount or unit price | Price missing on an order line | Flag for review; recover only from the source system, never estimate | Revenue has to match the books |
| Customer ID | Guest checkout | Leave blank; do not invent IDs | A made-up ID creates customers who do not exist |
| Discount code | No discount used | Keep the blank and document that it means no discount | The blank is true and carries meaning |
| Shipping date | Order not yet shipped | Leave blank | The event has not happened |
| Product category | Missing on some lines | Fill from the product catalog | The true value exists in another source |
| Customer region as a model input | Missing for some customers | Estimate for the model only, with a marker | Some models or preprocessing steps require a value; the CRM does not |
The last row needs one safeguard. The scikit-learn guide to imputation notes that preserving the information about which values had been missing can be informative, and its imputers can add an indicator column for that purpose. A filled region, kept next to a column that says it was filled, can let a model learn from the gap as well as the estimate. The data imputation entry in CUBIG’s glossary covers the common methods.
What happens to the numbers when rows with missing data are dropped?
Dropping incomplete rows changes totals as well as row counts. In CUBIG’s analysis of the UCI Online Retail data, removing the 135,080 lines without a customer ID leaves 406,829 lines. The removed lines carry 14.85% of net sales value and 16.28% of gross sales value from lines with a positive quantity.
| Analysis | Keep lines without a customer ID? | Reason |
|---|---|---|
| Revenue by month, product or country | Yes | Sales happened whether or not the buyer was identified |
| Customer segmentation or repeat-purchase analysis | No, but record the exclusion | Lines cannot be assigned to a customer |
| Customer churn or lifetime value model | No, and report the share excluded | The model describes identified customers only |
| Stock and returns analysis | Yes, with adjustments reviewed | Adjustment lines may be blank on purpose |
The same table also shows why one cleaned file rarely serves every task. A version prepared for customer segmentation should not feed the monthly revenue dashboard, and the reverse is also true.
How did CUBIG calculate these figures?
CUBIG calculated every UCI Online Retail figure in this article from the original file, without removing or correcting any rows first. The steps below reproduce the line and sales-value shares; the country and product-description counts come from the same unmodified file.
- Source: the Online Retail file downloaded from the UCI Machine Learning Repository on November 11, 2026, with 541,909 lines from December 1, 2010 to December 9, 2011.
- Missing customer ID: lines whose CustomerID cell is empty, 135,080 in total.
- Net sales value: quantity times unit price, summed over every line. Cancellation lines (invoice numbers starting with C, 9,288 lines) and other negative quantities reduce the total; postage, fees and manual adjustments are included as recorded.
- Gross sales value: the same sum over lines with a positive quantity only.
- Robustness check: on product lines only, meaning stock codes that begin with a digit, which leaves out postage, fees, adjustments and other non-product codes such as gift vouchers, the lines without a customer ID carry 15.38% of net sales value, close to the 14.85% for the whole file.
- Country split: lines with Country “United Kingdom” against lines from all other countries.
- Not adjusted: 5,268 lines that exactly repeat an earlier line were kept as recorded, and values are in pounds sterling as recorded, with no adjustment for inflation.
import pandas as pd
df = pd.read_excel("Online Retail.xlsx")
df["value"] = df["Quantity"] * df["UnitPrice"]
missing = df["CustomerID"].isna()
print(missing.mean())  # share of lines without a customer ID
print(df.loc[missing, "value"].sum() / df["value"].sum())  # share of net sales value
pos = df["Quantity"] > 0
print(df.loc[missing & pos, "value"].sum() / df.loc[pos, "value"].sum())  # share of gross sales value
The data come from a single UK-based online retailer, and many of its customers are wholesalers, according to the UCI dataset page. The shares show how far one dropping rule can move the totals in that file.
How does combining channel data create new missing values?
Combining sales files can create gaps that neither source file had. Stacking a web shop export and a marketplace report leaves blank columns wherever one file lacks a field the other has. Joining orders to a customer table on customer ID leaves blank customer details for every order whose ID has no match, including every guest checkout.
In CUBIG’s Syntitan, data combination offers two methods. Union stacks rows from datasets of the same kind, such as sales from two half-years. Join connects different datasets on a shared key, such as customer ID, to add columns. Syntitan recommends a method when two datasets are selected and saves the result as a new dataset. The combined result is not diagnosed automatically, so the team starts a Ready for Raw Data project on the combined dataset, which runs the diagnosis, to check the new gaps.
Syntitan currently accepts 100 to 10,000 rows and up to 100 columns per dataset. The full UCI Online Retail file, at 541,909 lines, would have to be sampled or split into slices of a few days before it could be prepared there; every month in the file has more than 25,000 lines.
How does Syntitan handle missing data in sales records?
Syntitan’s Ready for Raw Data checks a sales dataset for missing values as part of its Integrity diagnosis and proposes treatments, each with its evidence, that the team can review, choose among or exclude. The diagnosis also covers duplicate records and type errors, such as text in a numeric field, and finds blanks written as text, such as “none”.
Each proposed treatment comes with its evidence: the problem found, the proposed change, before-and-after examples and what will be preserved. Where more than one method applies, the team chooses, for example between filling the gap, filling with 0 or excluding the rows. Blanks that carry meaning, such as “no purchase”, are kept. A treatment that would change information the task needs can be excluded and applied later if needed.
In Syntitan’s Easy Mode, items that are hard to change without a clear basis are left unchanged and marked as needing a check. Syntitan’s own commerce example shows the pattern: an order with no amount is flagged for review instead of being filled. The original dataset stays untouched, and each processing result is saved as a new Version, so the earlier state stays available and the prepared Version can be downloaded.
Reconciling the prepared totals with the team’s accounting system stays with the team, and finishing the processing does not mean the data has been checked against the task. Connectors and delivery of prepared data to other tools through MCP or API are in preparation; for now, the prepared Version is downloaded.
Pipelines and warehouses already test for gaps. dbt, for example, ships not_null and relationships tests among its four built-in generic data tests, and teams can write their own. A team that already runs such tests keeps them; Ready for Raw Data adds a task-level decision about how gaps are treated, with its reason and before-and-after examples, saved in a Version the team can return to and continue from.
CUBIG Shorts
Cataloged. Quality Rules Pass. Ready for What?
A short take on the same gap: a file can be cataloged and pass its quality rules and still lack what one task needs.
How do you check sales data after handling missing values?
Before prepared sales data feeds a report or a model, a team should confirm that totals still reconcile and that every estimated value can be traced.
- Totals: does the prepared revenue total match the source system for the same period?
- Row counts: how many rows were excluded, and is the list of excluded rows saved?
- Flagged items: how many values were flagged, and who resolves them by when?
- Estimated values: are filled values marked, and are they kept out of the system of record?
- Task fit: was this version prepared for the task now using it, such as revenue reporting rather than customer segmentation?
- Model effect: if the data trains a model, was the result compared with and without the treatment on the same evaluation records? How to evaluate a churn prediction model describes that comparison.
- Version: can the team name the data version, the treatments applied and the person who approved them?
Missing data is rarely only a cleaning problem. A blank customer ID, a missing price and an empty shipping date each say something different about the sale, and the right treatment depends on who will read the result. Teams that record those decisions alongside the data can change them later without starting over.
See how Syntitan flags a missing order amount in its commerce example: open the Commerce tab under the industry examples on Syntitan’s home page, which you can view without signing in, then sign in to start from its sample or try your own file of up to 10,000 rows per dataset.