
A support assistant’s answers got worse on Tuesday. The monitoring dashboard shows the same model, the same latency, and the same token cost.
LLM monitoring tracks an LLM application’s requests, responses, latency, cost, errors, and quality scores in production, and LLM observability adds traces that show how each request moved through prompts, tools, and model calls. Both can show that an output changed. Finding why often needs a record of which data the model read.
CUBIG’s review of Semrush US data in November 2026 found about 720 monthly searches for “llm monitoring” and about 1,000 for “llm observability,” with the top results led by tool vendors such as Langfuse, Splunk, Datadog, and Dynatrace. This article covers the part those pages spend less time on: the data side.
What is the difference between LLM monitoring and LLM observability?
LLM monitoring tells engineers how an application performs in production: how many requests it handled, how long responses took, how many failed, what each one cost, and, where the team has set up evaluators or user feedback, how quality scores move over time. LLM observability helps them investigate how the application produced one particular result.
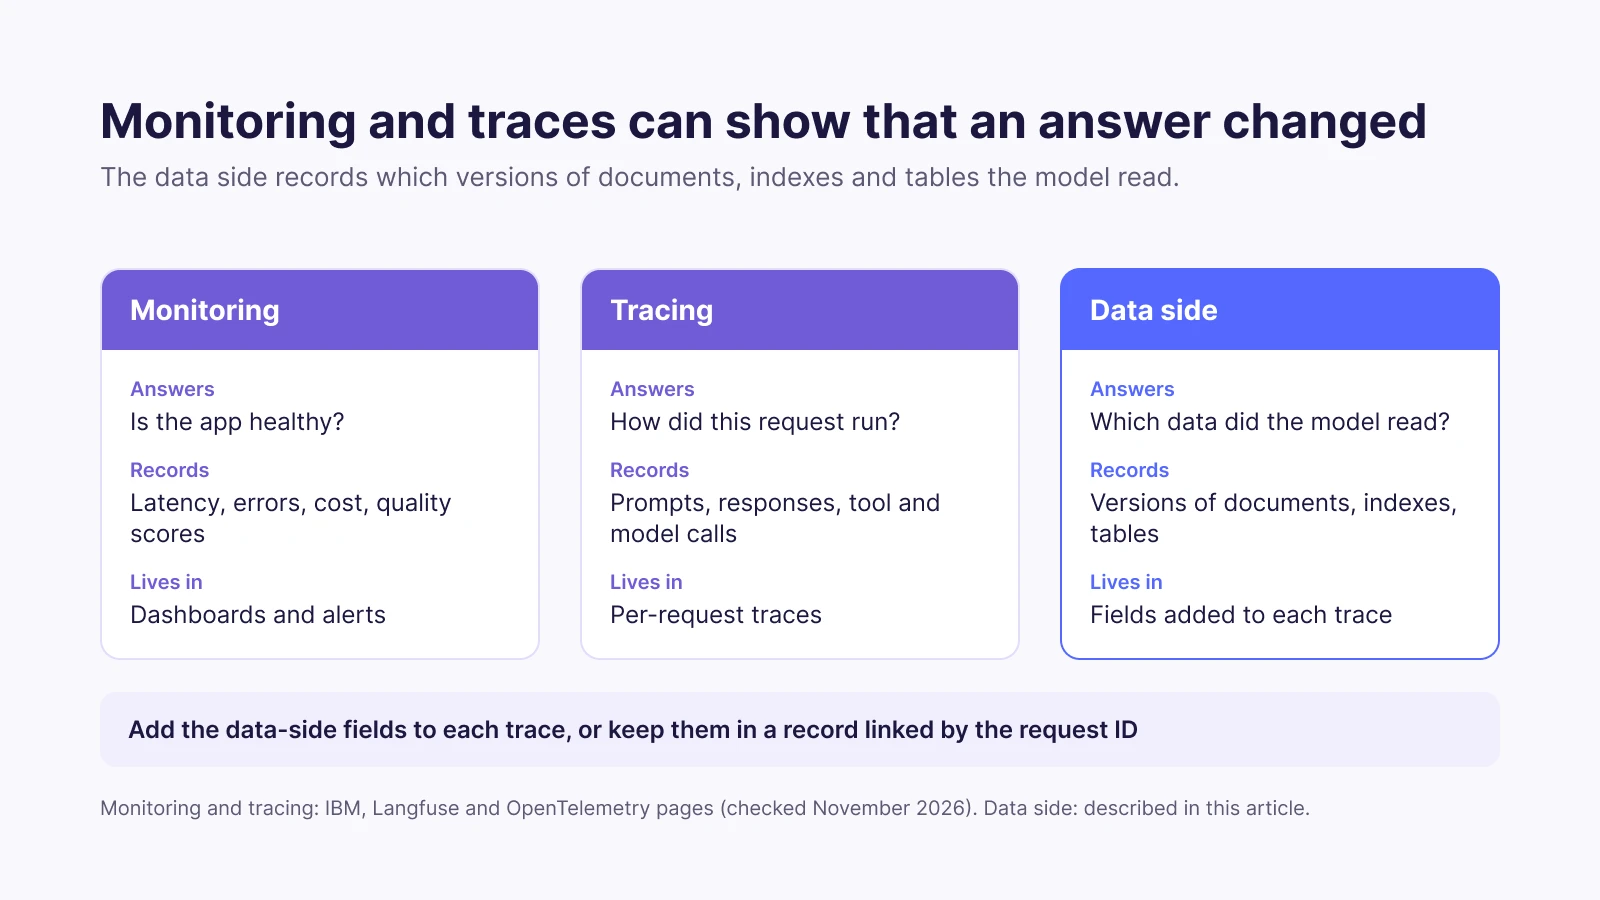
IBM defines LLM observability as collecting real-time data from LLM models or apps about their behavioral, performance, and output characteristics, and says a good observability solution collects metrics, traces, and logs from LLM applications, APIs, and workflows. The Langfuse guide to LLM observability names monitoring and tracing as two parts of observability: monitoring watches performance and behavior in real time through metrics such as latency, throughput, and error rates, while tracing captures the detailed execution path inside the application.
A trace of the support assistant can show which retrieval step ran, which passages came back, and which model call wrote the answer. The trace does not explain on its own why Tuesday’s passages differ from Monday’s. For that, engineers need to know which source documents and which retrieval index produced them.
What does an LLM monitoring setup usually record?
An LLM monitoring or observability setup usually records request settings, response details, performance metrics, and execution traces. The exact fields depend on the tool and the application.
An OpenTelemetry post on LLM observability from June 2024 lists the key signals: request metadata such as temperature, top_p, and the model name or version; response metadata such as tokens and cost; and metrics such as request volume, request duration, and cost and token counters. Tracing tools add the path a request took: the prompt, retrieval calls, tool calls, intermediate model calls, and the final response.
The signal lists in the IBM and OpenTelemetry pages cover model parameters, prompt and response details, tokens, cost, latency, quality metrics, and execution paths, but neither list includes the version of the documents, indexes, or tables behind those inputs.
A team investigating answer quality also needs to know which version of the data the application handed to the model. A trace may show that a retrieval tool returned five passages without naming the document snapshot behind them, or that a tool returned a business rule without saying which version of the rule table it read. The team usually supplies those data-side details itself, for example as trace metadata.
Why can an answer change when the model and prompt did not?
An answer can change with the same model and prompt when the application gives the model different information. Sampling randomness, provider-side model updates, and shifts in what users ask can also move answers; this section covers the data side. Retrieval-augmented applications pull from documents, indexes, databases, or business systems before the model writes anything, and each of those can change:
- A reference document was updated or replaced. The company edits the refund policy on Tuesday and keeps the filename, so retrieval returns different passages to the same prompt.
- The retrieval index was rebuilt. An engineer rebuilds the index from a newer source snapshot, and the same question now pulls different passages through what looks like the same retrieval step.
- A business rule or lookup table changed. A tool that checks eligibility or calculates a fee reads an edited table and returns a different result.
- The evaluation set changed. This one moves the score, not the answers: two runs used different questions or expected answers, so the score moved with no change to the system.
Google researchers described how data problems spread in the CHI 2021 paper “Everyone wants to do the model work, not the data work”. Sambasivan and colleagues define data cascades as compounding events causing negative downstream effects from data issues and, from interviews with 53 AI practitioners working on high-stakes AI in India, East and West African countries, and the US, report that data cascades are pervasive (92% prevalence), invisible, delayed, but often avoidable. Engineers who only look at model behavior can spend their investigation on the model when an upstream data change caused the drop.
What should the data side record next to each trace?
The data side should record enough to connect each model response to the information the application had when it ran. A team can add these records as custom attributes on each trace if its monitoring tool supports them, or keep a separate record linked by a trace or request ID:
- Reference documents: the version or snapshot date of each document set the application reads.
- Retrieval index: the index build ID and the source snapshot used to build it.
- Business rules and lookup tables: the version of each table the prompt or tools read.
- Evaluation set: the ID or version of the set used to score answers.
- Preparation history: which preparation rules changed the data, and when.
- Approval: who approved each data or source change.
With these records, an engineer comparing two traces can see that both used the same model and prompt but different policy snapshots, and look at the document change first. CUBIG’s article Which data version passed the test? covers why a team needs the exact data state behind an evaluation result.
How do you find the cause when quality drops?
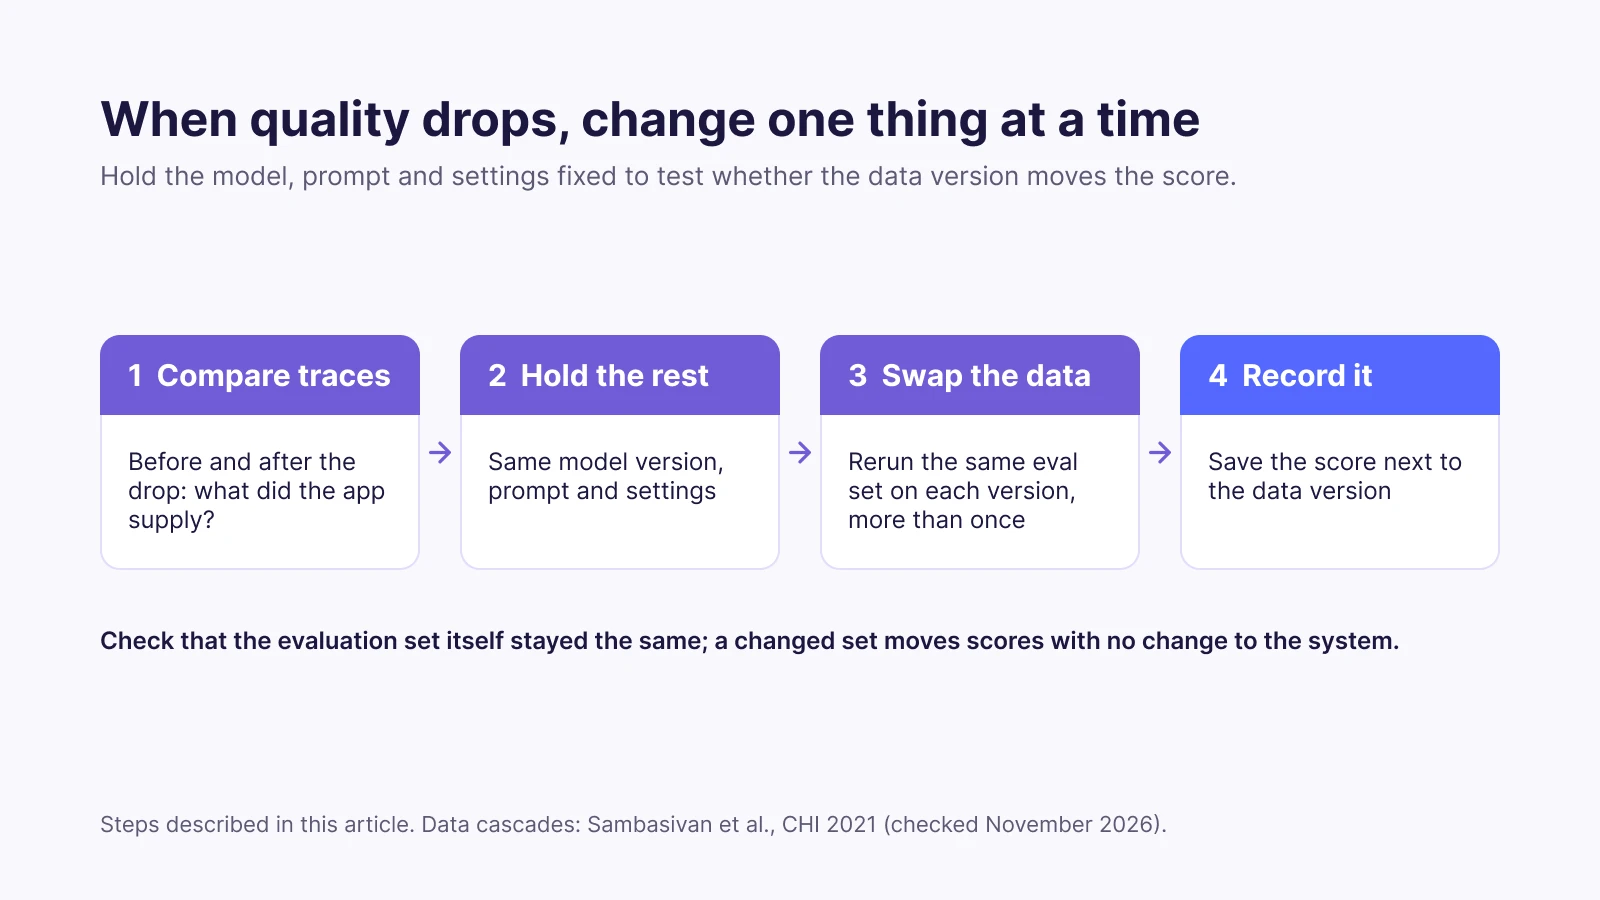
Engineers can narrow down the cause by comparing runs under controlled conditions and changing one data input at a time:
- Compare traces from before and after the drop. Pick representative requests and look at the prompts, tool calls, retrieval results, and responses. Look for differences in what the application supplied, not only in the final answers.
- Keep the model, prompt, and settings fixed. Use the same model version, system prompt, and generation settings for both runs.
- Switch only the data version and rerun the same evaluation set. Score the earlier and later data versions on the same questions and expected answers, and run each more than once if answers vary between runs.
- Change one thing at a time. Test the suspected document first, then the index, the rule tables, or the preparation rules, each in its own run.
- Record the result next to the version. Save the score, the data version, and the changes behind the run so another engineer can repeat the comparison.
The team should confirm that the evaluation set itself stayed the same throughout; CUBIG’s guide to keeping a golden dataset when OpenAI Evals shuts down covers that part. For a model migration, freezing the data version keeps the comparison to one change, unless the new model forces a data change such as an index rebuild.
Syntitan, CUBIG’s AI-ready data platform, works on the data preparation side of this process. Syntitan keeps the original Dataset, starts each use-case Project from a copy, and saves preparation and check results as Versions, so a team can tell which data Version a Syntitan check result came from. For supported binary classification tasks, Syntitan compares results before and after data preparation under the same evaluation conditions; for agent work, Syntitan builds Tasks and Cases from business documents, and the team runs those Cases in its own agent environment. Syntitan does not replace an LLM monitoring or observability tool.
Monitoring dashboards and traces give engineers evidence about production behavior, but a quality drop that started with a data change stays hard to explain until the team can name the documents, rules, indexes, and prepared data the application used. Recording those details does not remove every unknown; it gives the team a repeatable way to check one change at a time.
See how Syntitan keeps data versions and before-and-after checks for one AI task.