
An AI readiness assessment for data checks enterprise data on six axes, Usability, Integrity, Context, Consistency, Reproducibility, and Traceability, and returns a Data Readiness Score for each, from 0 to 100%. Most AI readiness assessments grade the organization: its strategy, people, and tools. This one looks at the part a model actually runs on, and adds a ranked list of what to fix first. The score describes the common baseline. It is not a prediction that a specific AI will succeed; that is validated separately, with the model or agent you choose.
By Bae Ho, Founder & CEO, CUBIG Corp. · Last updated: September 2026.
What is an AI readiness assessment? Most AI readiness assessments grade an organization: its people, budget, and tooling. This one assesses the data, the part a model actually runs on. You score the data on six axes instead of grading it with one number. Each axis checks something different a model needs: whether it can read the data, trust the values, understand the meaning, rely on it across runs, rebuild a past result, and trace every output to its source. A low score on any one axis can block a release.
Almost everyone in enterprise AI agrees the data has to be AI-ready. Far fewer can say what that means, and fewer still can put a number on it. So readiness becomes a feeling: a team looks at a dataset, decides it seems clean enough, ships it, and learns in production whether it was ready. It is also where many projects stall. In an S&P Global survey of 1,006 IT and business leaders in North America and Europe, conducted in late 2024, companies reported scrapping 46% of AI proofs of concept on average before production. In Informatica’s CDO Insights 2026, 57% of 600 data leaders across the US, Europe, and APAC named data reliability as a barrier to moving AI from pilot to production.
I have watched this play out the same way across regulated deployments. A model passes every test the data team runs, ships, and then drifts the week a data window rolls forward or an upstream schema changes by one column. The model was never the problem. The data state that reached it had moved, and nobody could say when or by how much.
Why are there six readiness axes instead of one data-quality score?
A model can fail six different ways, and they do not share a remedy. The data arrives unusable, or wrong, or stripped of the meaning the model needed. Or it stays readable but drifts between runs, can’t be rebuilt, can’t be traced. A single data quality number folds all six into one digit and hides which failure is about to break your deployment.
The axes pull the failures apart so the score points you at the cause. One low axis is usually enough to block a release, which is why a reading across all six is more honest than one composite metric. When a deployment stalls, a six-axis read shows which axis is dragging and what raising it unblocks, instead of leaving the team to argue about whether the data is good.
What are the six readiness axes?
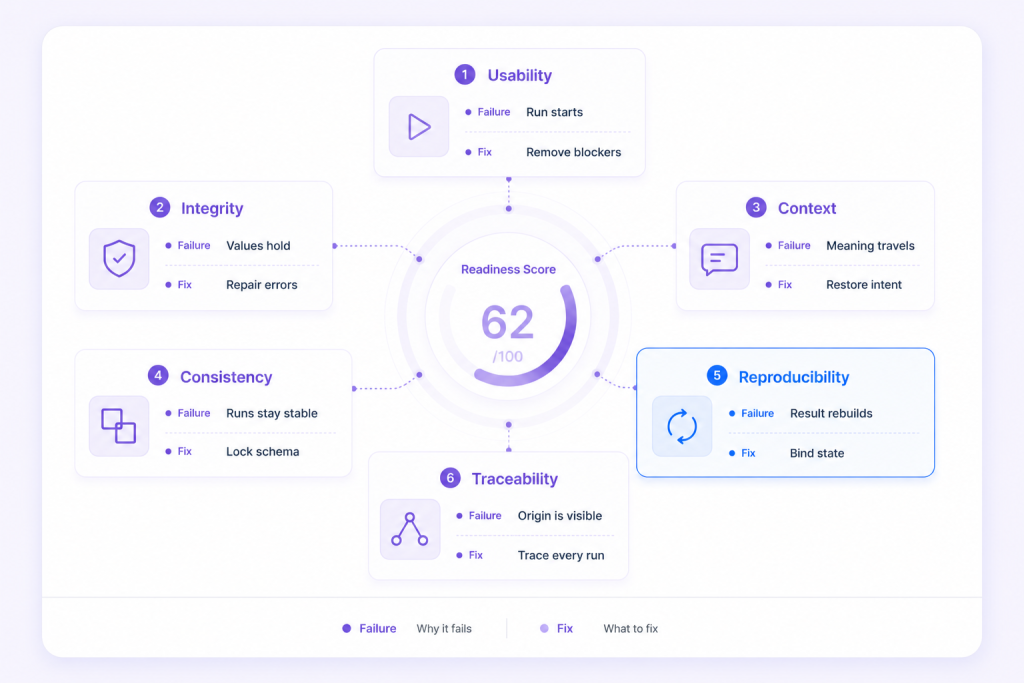
Each axis answers one question a model asks of the data, and each maps a specific production failure to a specific fix.
What is an AI readiness score?
An AI readiness score is the composite number these six axes produce. Syntitan reports it as a Data Readiness Score: a percentage per axis from 0 to 100%, an overall readiness figure, and a ranked list of fixes. The composite is not an average you can game. One low axis can block a release on its own, because a model that cannot read a locked column does not care that the rest of the data is pristine. A Context score drops when fields carry no description, when nulls have no defined meaning, and when the relationships between tables are undocumented; the score reflects how much a model would have to guess. That is what makes the number tell you what to do next: it names the axis, and the axis names the work.
Each axis has its own inputs. The table below names what drives each percentage down, so the score is something you can audit rather than take on faith.
A real readout looks like a row of numbers, not one. A dataset might come back Usability 92, Integrity 88, Context 41, Consistency 60, Reproducibility 30, Traceability 35. The overall figure is gated by the lowest blocking axis, so this dataset is not 63% ready in any usable sense: Context at 41 is what a model trips on first. The ranked fix list puts adding field descriptions and null semantics at the top, because that single move raises Context the most points for the least work.
One boundary matters. A high score means the data clears the common baseline. It does not mean a given model will reach a target, and a low score on one axis does not prove the data is the cause of a failure. Those questions are answered in use case validation, where the model, the task, and the evaluation criteria stay fixed and only the data state changes.
Is an AI readiness score the same as a data quality score?
No. Quality tools check nulls, types, and duplicates, and they should; that work feeds the Integrity axis. But a dataset can pass every quality check and still score low on Context or Consistency, and still break the model the day it runs.
The common objection is fair: a data team that already runs data quality tests or a governance catalog will ask whether this is the same thing. Those tools score the Integrity axis well and touch Context, but none of them score against a running model or hold a reproducible data state, so they cannot tell you where you stand on Consistency, Reproducibility, or Traceability. That is the line a catalog-versus-platform comparison draws out in detail.
| Data quality score | AI readiness score | |
|---|---|---|
| What it checks | Is the data tidy: nulls, types, duplicates, ranges | Can a model run on it, learn from it, and let you explain the result |
| What it measures against | A schema or a rules dashboard | Execution: a real model and metric |
| Can it block a release | Catches bad values, not missing context or drift | Yes; one low axis can hold the release |
| Example failure it misses or catches | Misses a clean column whose meaning was dropped | Catches the dropped meaning as a low Context score |
So AI-readiness is the broader claim. A quality check confirms the data is tidy; a readiness read goes further and asks whether a model can actually run on the data and whether you can explain what it produced. A dataset can be clean and unready at the same time, which most teams discover only after a deployment has shipped. We unpack that distinction in What Is AI-Ready Data? and the way clean falls short of ready in AI-Ready Data vs Clean Data. Every platform now claims AI readiness; the six axes are how you ask ready for what.
How do you act on a readiness score?

A readiness score earns its keep only if it tells you what to do. The axes give you two moves.
First, the gaps become a plan. Syntitan does not return your data is 68%. It returns which axes are dragging the score and, once you connect a target model and metric, ranks the fixes by the points each one adds to that model’s performance. Raising Usability on a blocked column might be worth six points; trimming low-signal fields, two. The preparation gets ordered by impact instead of by a generic cleanup checklist.
Which fixes matter also depends on the task. The same data can need different preparation for each AI use, as we show in AI data preparation starts with the task.
Second, the score has to keep its meaning after the data moves. A dataset that scores well today can drift tomorrow when a schema shifts or a window rolls forward, and that is where Consistency, Reproducibility, and Traceability earn their keep, held in place by a fixed reference point. Four operations carry that weight:
Seals the exact data a run used, so the state behind a result is fixed rather than assumed.
Ties each AI or agent run to the Release State it ran on.
Compares two states to narrow what actually changed between them.
Returns to the state behind any past result and rebuilds it.
The regulated case makes this concrete. When an auditor questions a credit decision or a clinical model’s output from eighteen months ago, you reproduce the exact Release State the model ran on, diff it against today’s data to show what moved, and trace each value to its source. Government guidance points the same way: the NIST AI Risk Management Framework frames trustworthy AI around documented, reproducible provenance, which is exactly what a fixed data state gives you. Data you can govern and reproduce is what keeps a project in production for years instead of quietly dying. A readiness number that no fixed state stands behind tells you almost nothing the day output drifts, which is why a model nobody changed can still start drifting: the data state moved underneath it.
The axes and the state are two halves of one idea. Scoring tells you whether the data is ready to run; the bound state keeps that judgment true after the data changes underneath you. A score on its own captures how confident you are today. That confidence is exactly what erodes between the pipeline that worked last quarter and the same pipeline now.
How does Syntitan measure the six readiness axes?
Syntitan is the AI-Ready Data Platform built around the six axes. It profiles a dataset’s signals per axis to produce each score. Whether the data fits a specific task is then validated with the model or agent you choose, and the result is Qualified, Not Qualified, or Inconclusive. Where you connect a target model and metric, it weights the recommended fixes by the lift each one measures against that model. Syntitan then rebuilds what blocks execution without dropping the structure or context a model needs, and binds every AI or agent run to a Release State you can diff and reproduce. The pattern is simple: make the data ready, then keep it reproducible. That is the job of an AI-ready data operating layer, the missing layer between data management and AI execution, and it gives you a reproducible AI-ready state rather than a one-time cleanup. Any readiness or performance figure you see is representative until you reproduce it on your own model and data.
How do you run an AI readiness assessment on your own data? (a 5-point check)
Five yes-or-no questions to run before your next planning meeting:
- Do you have a number for readiness across all six axes, and have you checked the data against the task and the model you will be judged on?
- In your gold tables, can you still say why a given field is blank, or has that context already been dropped?
- When output drifts, can you diff the data state to see what moved, or do you start by retraining the model?
- Can you take any past result and reproduce the exact data it ran on? In a regulated setting, if you cannot, you may not be permitted to use that result at all.
- If one axis came back low, would you know which fix raises it, and how many points it buys?
If the honest answers run to no, the thing holding your AI back is the data state that reaches the model. The way to find out is to measure it, on all six axes, every release. None of this is the same as orchestrating tools across a stack; it is making one dataset readable and reproducible before a model ever touches it.